Private Equity Midyear 2023 Report
Down, But Not Out – Middle-Market PE Holds Strong
More than 12 months of inflationary pressures, rising interest rates, market volatility and global banking instability continued to damper private equity (PE) activity during the first half of 2023. Deal markets are feeling the full effects of uncertainty that is rampant across global markets. PE investments, exits and fundraising have been more difficult since last summer when global monetary policy shifted to rising interest rates in an effort to curtail surging inflation.
In our midyear report, we unpack some of the current trends and offer a view ahead to the rest of 2023 and beyond.
Key Takeaways
- Uncertainty from economic headwinds, market volatility and banking instability continue to cloud deal markets.
- During the first half of 2023, PE investments, exits and fundraising continued the slump that began last year.
- Expectation gaps in valuation are growing larger between buyers and sellers.
- Purchase price multiples are in correction mode—in many cases down 20% or more from the highs posted in 2021.
- The proliferation of add-on deals in consumer-driven markets fuels middle-market “buy-and-build” growth strategies.
- Deals are still getting done, and middle-market PE activity is a bright spot in an otherwise foggy M&A landscape.
Dealmaking Slowed from 2022, but Outpaces Pre-pandemic Activity
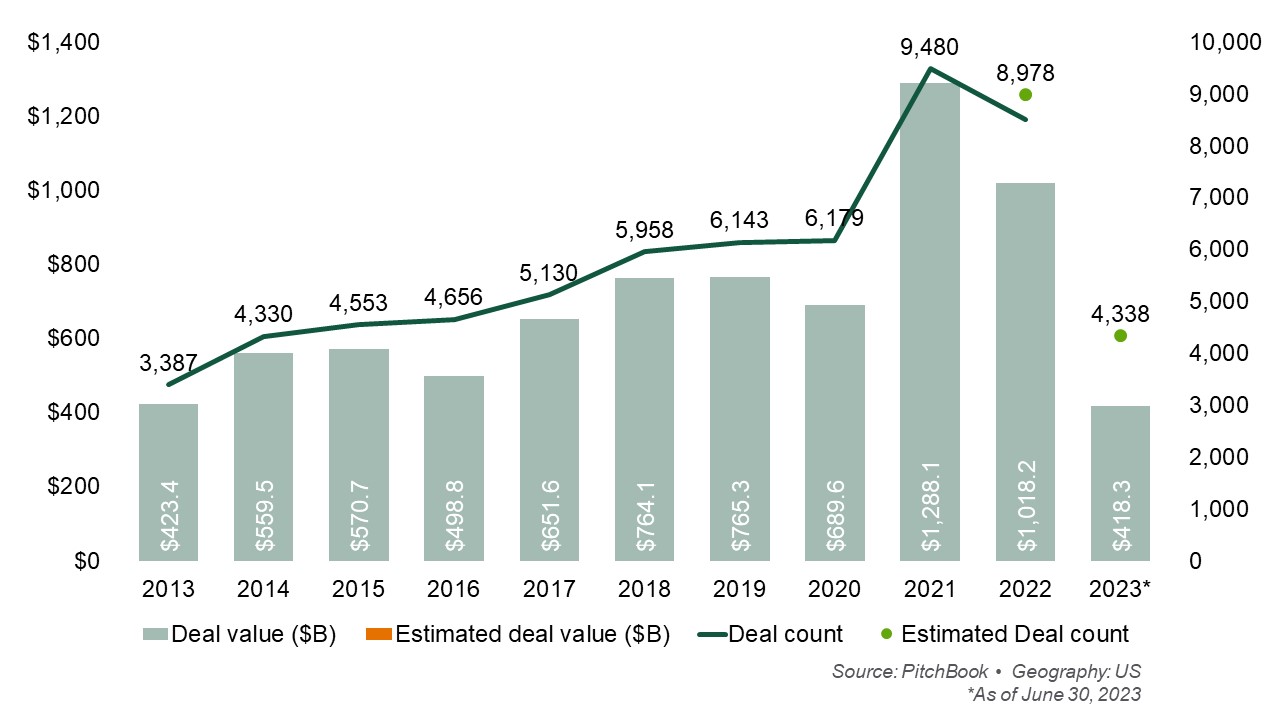
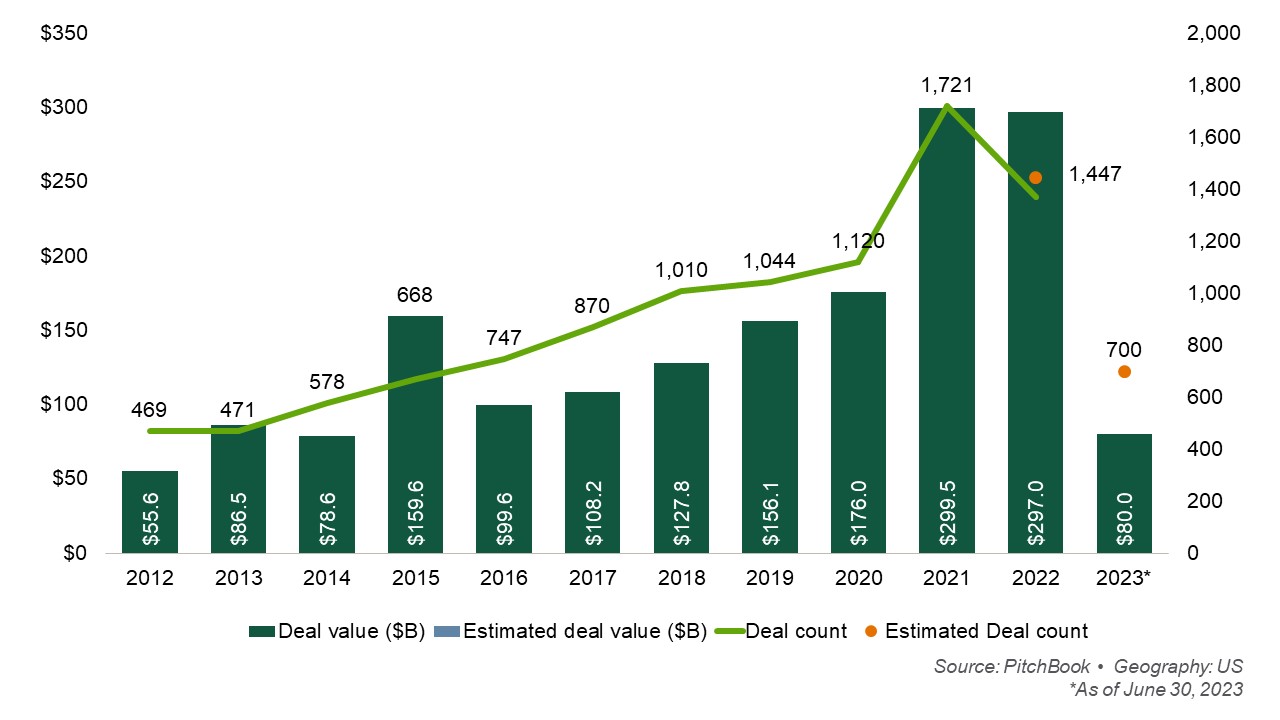
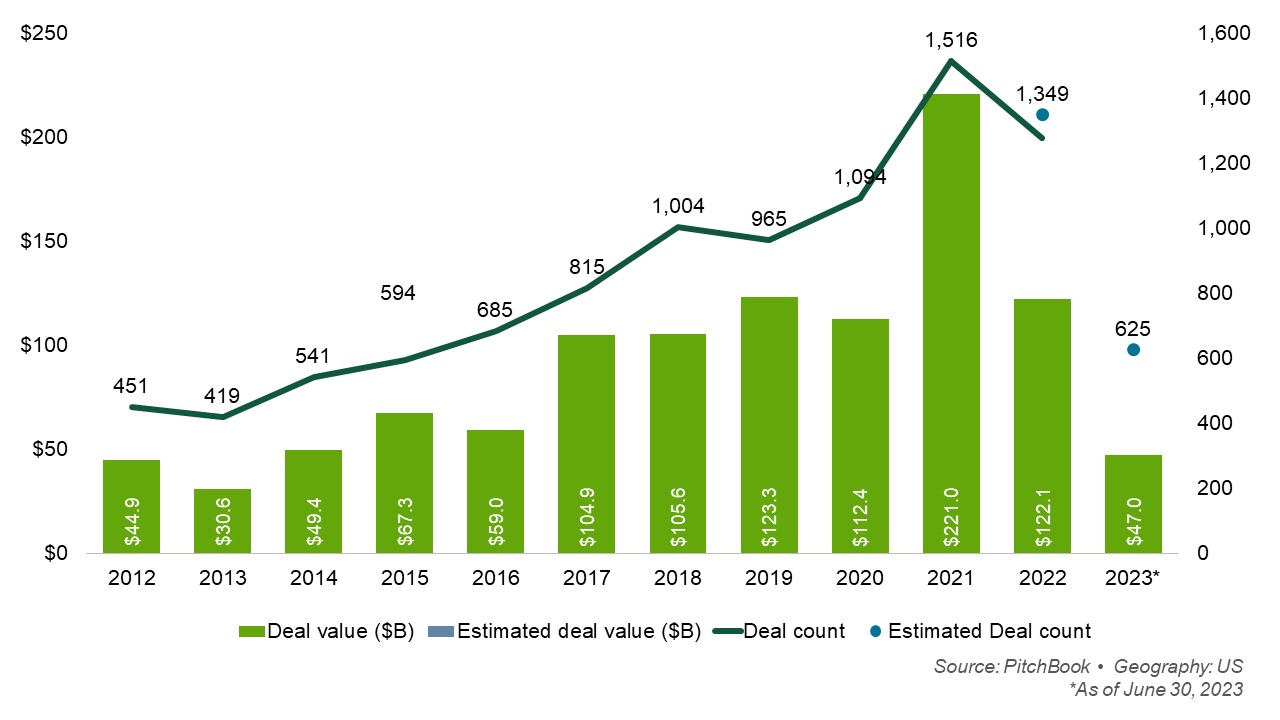
During the first half of 2023, continuing macroeconomic pressures stymied deal flow and PE exits. PE-backed deal values totaled $418.3B in the first half 2023, a decrease of 30% from a year ago, marking the slowest first half for PE dealmaking since the grips of COVID in 2020.
U.S. PE Deal Activity
PE Exit Activity Remains Sluggish as Fund Managers Hold Out for Better Returns
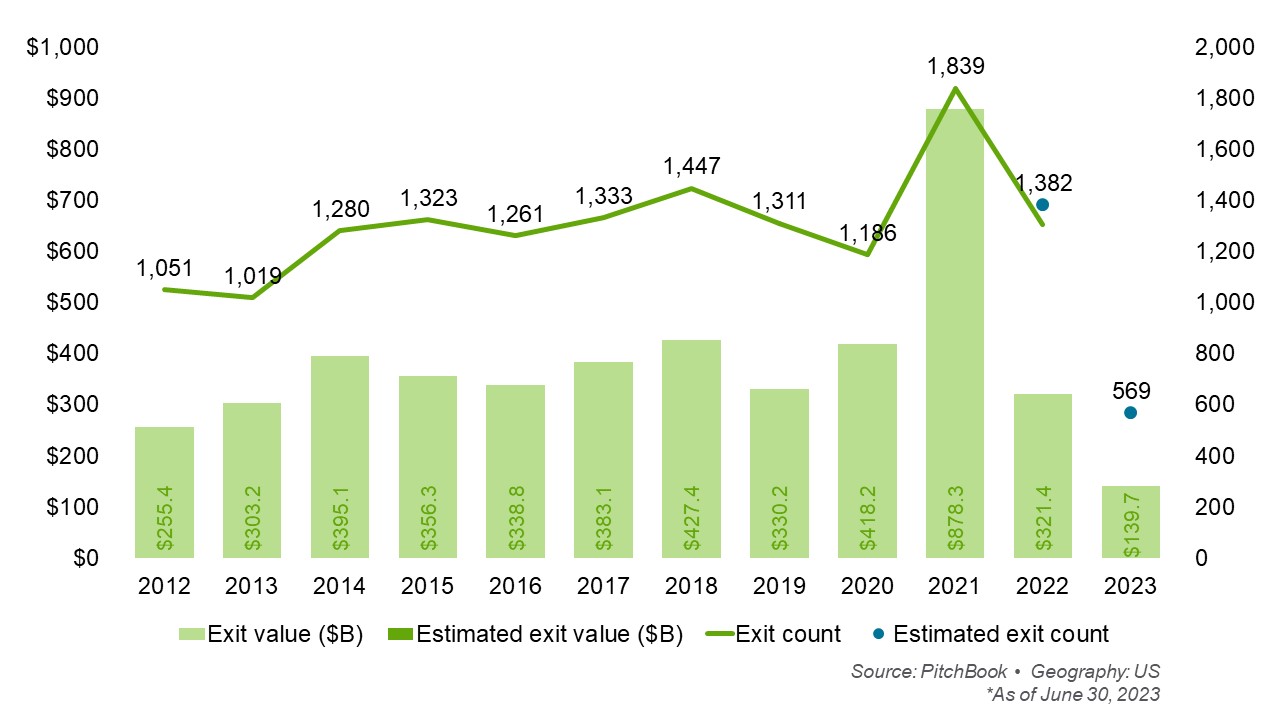
Many fund managers are sitting on a historically elevated number of portfolio companies under their control. The pullback in deal markets means longer hold periods for fund managers who are sitting on unrealized value in their portfolios. On an annualized basis, both exit values and exit counts are down as much as 50% or more. Managers appear to be holding out for pricing improvements before conceding on selling to another sponsor or corporate buyers, who are looking to pick off opportunities at big discounts to inflated valuations seen in 2021.
U.S. PE Exit Activity
The PE industry is not traditionally known for patience, but fund managers will likely continue taking a “wait-and-see” approach until signs of economic stability emerge and revitalize M&A markets. As fund managers await these signs, they are taking inventory of their existing investments, evaluating performance and assessing remaining upside potential in their portfolio. To realize value creation opportunities, fund managers are also highly focused on implementing business transformation strategies designed to refresh and better position their portfolio companies.
Middle-Market Activity Increased Significantly, Accounting For Nearly 60% of All U.S. PE Deals by Value
While dealmaking activity has been dampened overall, middle-market companies ($100M-$500M) continued to garner a significant level of attention from PE in the first half of 2023. The strength in middle-market deals stems from several factors, including an increase in “add-on” acquisitions by PE firms looking to bolster their existing platform investments and an easier ability to obtain financing compared to so-called “mega-deals” (>$5B).
U.S. PE Deal Value ($B) By Size Bucket
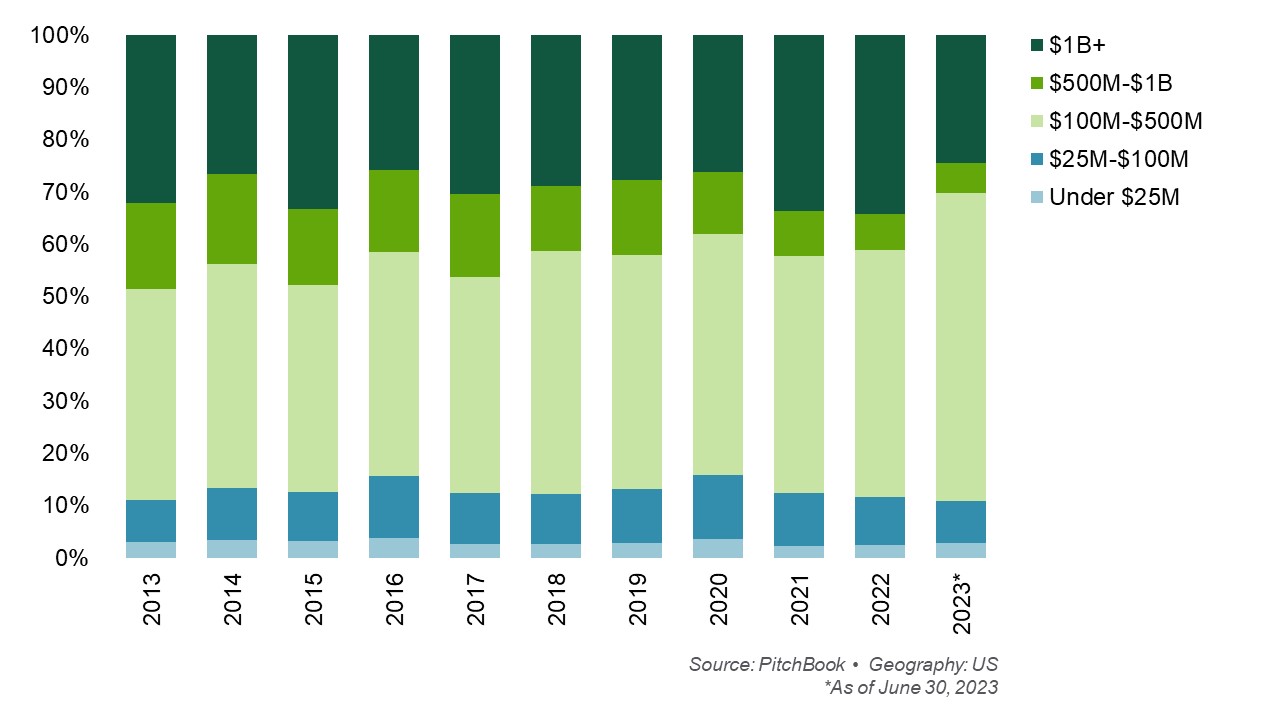
Even as buyers remain selective, quality companies with strong margin profiles can squeeze out premium valuations. This trend is expected to continue throughout the year. Notably, only a handful of mega-deals were closed, reflecting the ongoing pressure on M&A valuations and liquidity, particularly related to credit availability.
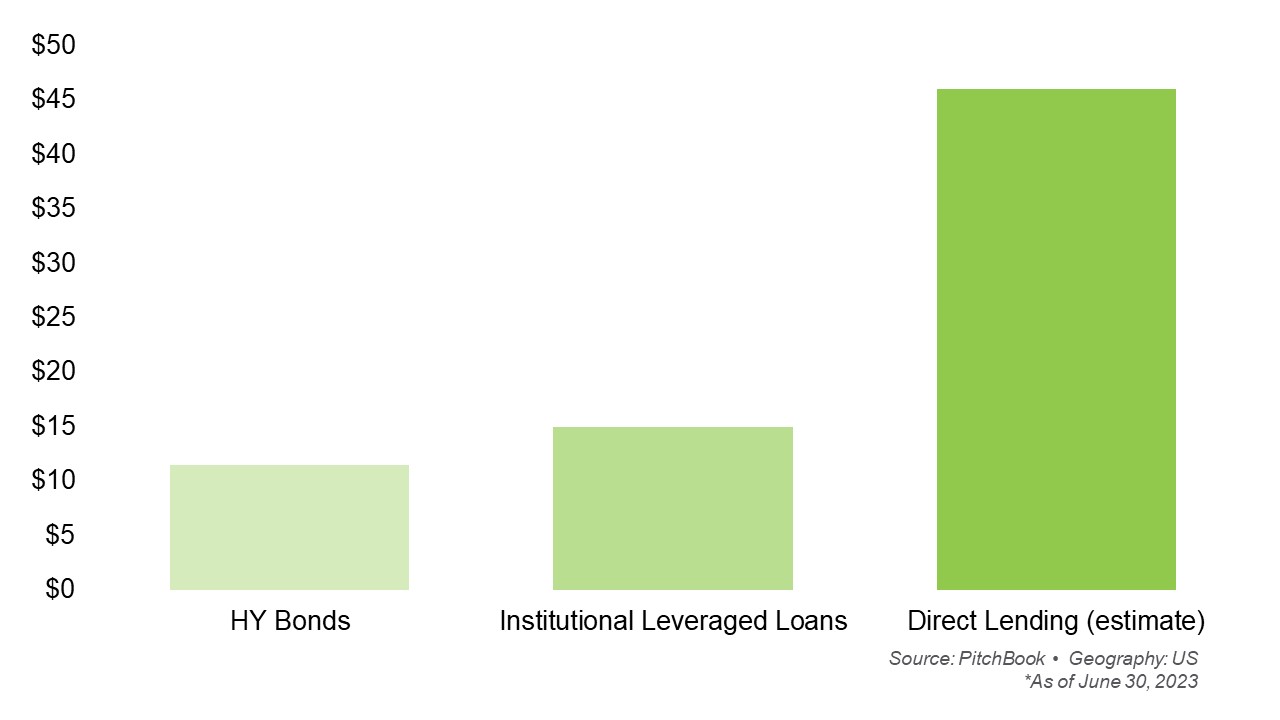
Private Credit Accounted For More Capital Growth Towards M&A Than High-Yield Bonds and Leveraged Loans Combined
As banking instability surfaced in early 2023, traditional sources for M&A financing shifted to very conservative underwriting practices, making it harder to get a loan. Private credit has been the beneficiary of more conservative lending practices in place by traditional banks. Private credit continues to increase in popularity and plays a significant role in funding middle-market deals.
In particular, the emergence of direct lending is attracting investor attention. Approximately $50B in direct lending was used in M&A in the first half of 2023, compared to high-yield bonds ($11B) and institutional leveraged loans ($25B). Direct lending is benefiting from difficulties in other parts of the funding market as well. With inflationary pressures and rising interest rates, activity in syndicated offerings has declined. Sponsors and borrowers are increasingly looking for longer-term partnerships, with private credit solutions offering additional flexibility, reliability and speed of execution.
New-Issue Volume to Fund M&A ($B)
PitchBook reported that private credit loan defaults declined in Q2, following two consecutive quarters of increases. The overall default rate of private credit loans was 1.64%, down from 2.15% in Q1 and 2.06% in Q4 2022, but we’re certainly not out of the woods. The syndicated loan market continues to show signs of rising credit distress, with the default rate of the Morningstar LSTA US Leveraged Loan Index reaching its highest level in two years. Some view syndicated default rates as a proxy for private credit defaults, as the trends tend to move in tandem. However, the expectation is that private credit will outperform the syndicated loan market or the bond market in these environments. We expect private credit to remain attractive, but the focus in the coming year will be on quality assets and underwriting.
“Private credit has been gaining market share from broadly syndicated loans (BSL) for some time now, but many market participants believe private credit is still having a ‘golden moment.’ Even when overall deal volume slowed in Q2, direct lending still outpaced BSL deals by a wide margin.”
— Erin Davis, Director, Valuation Services
Valuations Trend Downward, and Buyers and Sellers Grapple With Expectation Gaps
Deal market uncertainties are driving larger valuation expectation gaps between buyers and sellers, and contracting multiples point to full correction mode for buy-outs of all sizes. The facts point to decreasing valuations regardless of whether you measure valuation on enterprise value (EV) to EBITDA or EV-to-revenue (which often is considered a more meaningful measure which captures technology valuations where EBITDA is either not meaningful or absent all together).
Median PE Buy-out EV/EBITDA Multiples
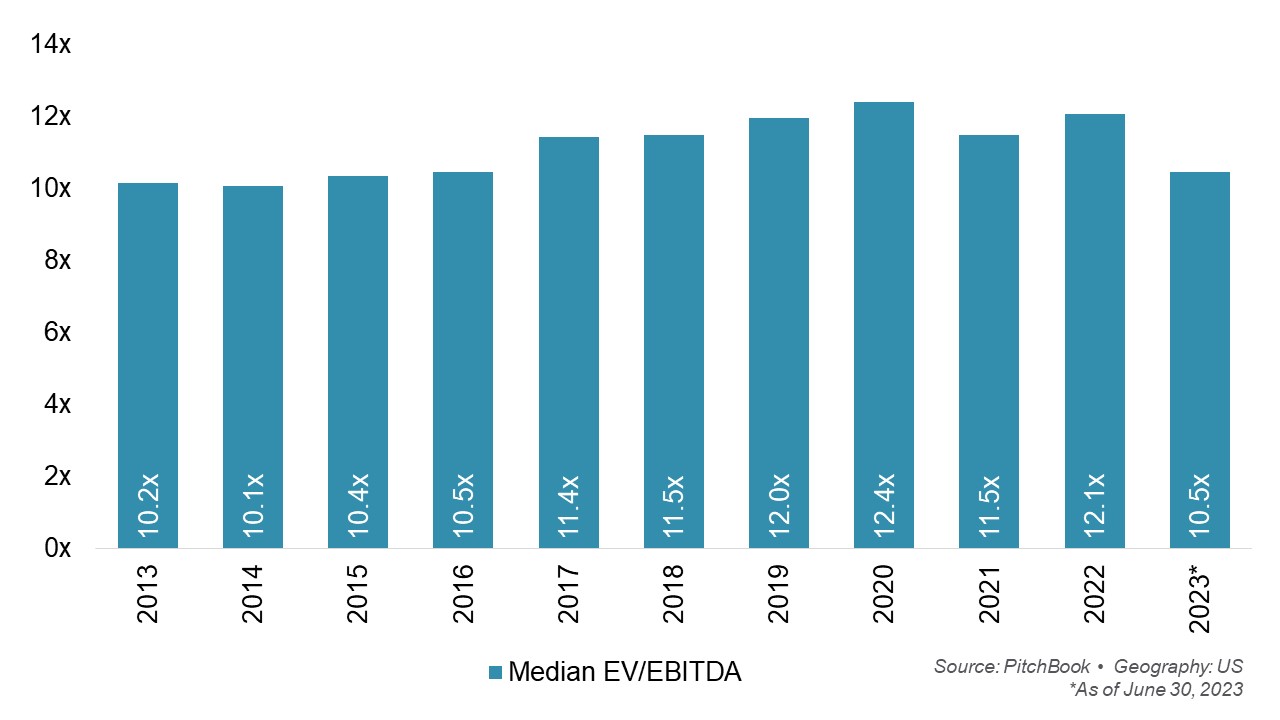
Middle-market buy-out multiples tell a similar story, but evidence points to this market reaching peak EV-to-EBITDA in 2020. On the surface it would seem that multiples paid for middle-market companies are at a slight discount to the overall PE market. However, this masks the improved multiples available for companies with scale.
Deals in the sub $100M category have median EV/EBITDA multiples of 6.4x. The rate increases to38% for EV/EBITDA valuations in the next category up ($100M-$250M). However, mega-deals of $5B and above are in their own league with median multiples of 16.9x for EV/EBITDA. Clearly, buyers are willing to pay up for size and scale.
Carve-outs Make a Comeback as Corporate Divestitures Surge
As persistently higher interest rates and inflation pressure dampen the earnings outlook, corporations are increasingly seeking opportunities to raise cash from divesting of non-core business segments; thereby strengthening their balance sheets. With ample dry powder at their disposal, funds have been eager take on deals that present a compelling opportunity to acquire business segments that have been ignored by their corporate parent but still have upside opportunities in revenue and profitability growth.
Carve-outs as a Share of All U.S. PE Deal Count by Quarter
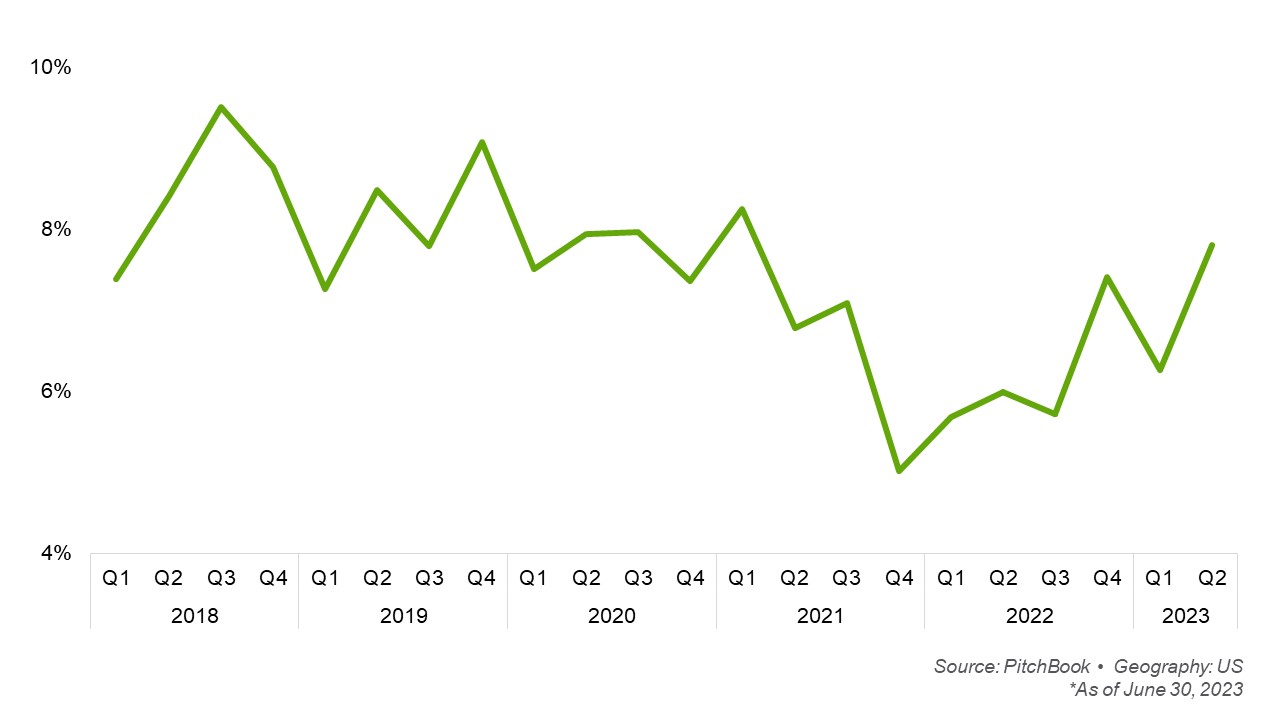
In Q2 2023, carve-outs made up 7.8% of all U.S. PE deals, the highest share in recent quarters. Of just buy-out deals, carve-outs made up 10.3% YTD, and accounted for 7.0% of all U.S. PE activity, which is a slight uptick from 6.6% in 2021 and 6.2% in 2022, which were record lows for carve-out activity due to the bull market. While YTD carve-out share of U.S. PE is still below the last 10-year average, persistent slowness in the global economic environment indicates carve-out activity is likely to increase as more corporates spinoff assets to buoy their balance sheets.
Add-on Acquisitions Stand Out as Financial Sponsors Pursue Buy-and-Build Strategies to Capture Market Synergies
The tried-and-true strategies associated with add-on deals is nothing new and is no longer isolated to just healthcare services. Financial sponsors are executing roll-ups in many consumer segments including HVAC, pest control, and landscaping maintenance and services, to name a few. This approach captures the essence of building size and scale in fragmented markets, while realizing revenue and cost saving synergies.
During this period of tighter credit and market dislocation, add-ons have been instrumental in keeping the PE flywheel spinning. The sharp rise in interest rates over the last 18 months has shut off the spigot of cheap, easily obtainable debt financing, making lower middle-market add-on acquisitions more attractive to PE. Add-ons as a share of all PE buy-outs have risen steadily every year over the last decade.
Add-on Percentage (%) Of U.S. Buy-out Activity by Year
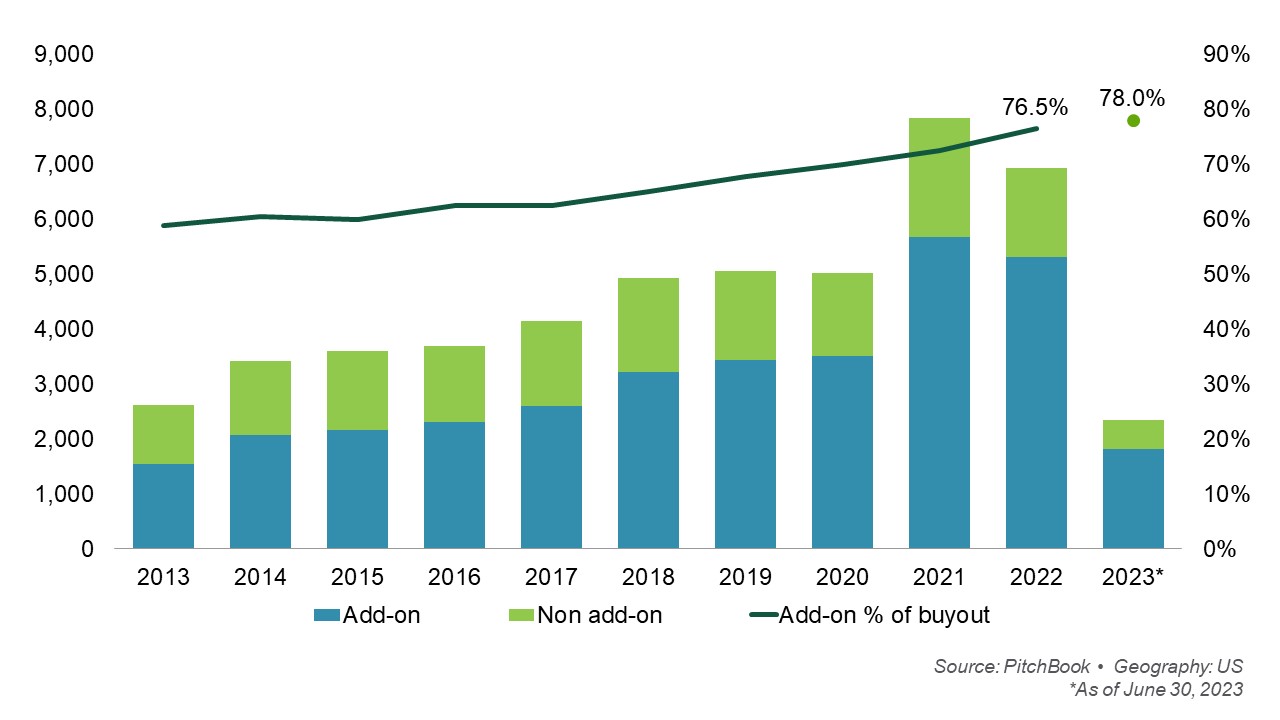
Historically, that increase is one or two percentage points, but in 2022 and so far in 2023, growth has been far more significant. Add-ons as a share of all buy-outs expanded by four percentage points in 2022 from 72.5% in 2021 to 76.5% before adding another point-and-a-half in the first six months of 2023 to stand at 78.0%.
“Add-on deal activity continues to remain strong in the middle-market and lower middle-market consumer and residential services sectors, despite economic headwinds that are impacting larger transactions. In fragmented services sectors, middle-market funds are attracted to the value that can be realized through sourcing proprietary deals, closing these add-ons at favorable valuations, realizing operational efficiencies through size and scale, and then exiting at higher multiples.”
— Jesse Rawls, Director, Deal Advisory Services
Technology Sector Deal Activity Continued Its Slowdown, but Key Indicators Provide Optimism
The technology services M&A market in 2023 is in a transitory phase with global macroeconomic uncertainties prompting buyers and sellers to recalibrate their strategies. Despite market volatility in the technology industry throughout 2022, PE sponsors still put capital behind the technology sector. Appetite for deals remained resilient as PE investors tend to be long-term oriented and focused on attractive growth prospects in technology-enabled businesses.
Technology sector deals slowed in Q2 2023, following a busy Q1 that saw six software take-private transactions announced totaling more than $23.5B. Taken together, this makes for a decent H1 2023, with 700 PE deals in the technology space, equating to $80.0B in total value. While this is well below the heydays of 2021-2022, it is consistent with H1 levels seen before the pandemic. Buy-outs continue to be the preferred approach here, accounting for 76.0% of deals, like last year’s 76.7%, with the balance comprising of growth equity and a handful of platform creation deals.
U.S. Technology PE Deal Activity
Healthcare Exemplifies Growth and Resiliency in the Face of Headwinds
Healthcare PE buy-out deal activity continued to show resilience in H1, as the sector accounted for 16.0% of PE deal flow. Deal volumes for health services are holding steady in 2023, even as the sector faces headwinds from high interest rates, increased regulatory scrutiny and other macroeconomic concerns. Still, large, notable PE deals in healthcare were hard to come by; over the past five years, there has been an average of ten $1 billion-plus deals, but there have been none so far in 2023.
Deal volumes declined 5% in the 12 months ending June 15, 2023, compared with 2022, and deal value declined 15%. However, there is broad optimism about healthcare M&A activity for the rest of 2023, anticipating that corporate and PE players have plenty of cash to spend, and health services companies face a climate that demands adaptation and change towards PE investments.
U.S. Healthcare Deal Activity
Summary and Outlook
Despite a relatively gloomy macro backdrop, PE activity has slowed but has not yet stalled. Dealmakers have found ways to bridge valuation gaps while adjusting to a high interest rate environment as they continue to pursue strategic transactions. The M&A market has a long history of responding to uncertainty and volatility with deals. Moreover, PE funds have become more specialized in industries and sub-sectors, which means they are more confident investing consistently through the ups and downs of the business cycle.
With the S&P jumping more than 15% in H1 and the technology-heavy NASDAQ market surging by more than 30%, public equity markets have posted a strong rebound in 2023. Inflation in most major economies is moderating, and the fears of global banking system contagion appear to be contained. Public market trends trickle down to private markets, albeit at a slow pace. Therefore, there is sentiment indicating the melt-up in equity markets and slowing inflation could be some leading indicators of emerging economic stability.
PE dry powder is holding steady at more than U.S. $1.2T, which could propel M&A markets to new highs in 2024 as investors begin to have increased confidence in economic stability. Signs that central banks may begin to reverse their current monetary policies could further bolster PE’s appetite to take advantage of end-of-cycle opportunities which have historically produced outsized returns for their limited partners.