


Rated and unrated feeder fund structures are becoming a more important part of private credit capital formation, particularly for insurance companies seeking access to private credit economics through capital-efficient formats. The opportunity is meaningful, and so is the valuation challenge, as these structures require independent, well-documented, audit-ready fair value processes.
That challenge has become more visible over the past year. Business development company (BDC) loss counts, single-fund net asset value (NAV) cuts, and a live gap between reported NAV and market price all widened in the first half of 2026 — and a sitting U.S. attorney has now said publicly that his office is scrutinizing valuation marks directly. This shift means independent valuation is now, more than ever, central to investor confidence.
Key Takeaways
- Rated feeder funds (RFFs) help insurers access private credit through rated-note structures that can improve regulatory capital efficiency relative to direct equity exposure, when the structure, ratings and statutory treatment support bond treatment.
- The same structure adds valuation complexity at a time when private credit is under heightened scrutiny for liquidity, marks, transparency, and governance.
- Notably, a reported NAV being tested against an instant-liquidity price, can cause the two to sharply diverge.
- A defensible, well-documented valuation process is critical for gaining investor confidence and withstanding regulatory scrutiny.
- The regulatory landscape is explicitly endorsing obtaining independent, audit-ready third-party valuation verification.
Market Snapshot: Rated vs. Unrated Feeders
Public market commentary indicates that cumulative disclosed rated-note feeder issuance exceeded $30 billion by mid-2025. The rated-note feeder market is visible through rating-agency publications and related market commentary. The unrated feeder fund (UFF) universe is broader and typically embedded within private fund and private wealth access channels rather than reported as a standalone market segment. As a result, RFF growth can be quantified directly, while UFF scale is best discussed within the broader private-fund and private-wealth feeder ecosystem.
Rated Feeder Market Signals
$22.5B
Rated debt across 138 tranches / 87 KBRA-rated middle-market credit feeder funds and facilities, as of June 30, 2024
$9B
KBRA-rated direct-lending feeder issuance through September 2025 — above every prior full year
$16B
KBRA-rated CFO issuance through September 2025 — above every prior full year
Broader Private-fund Market Context
Public reporting does not separately isolate total unrated feeder fund assets under management (AUM) or fund count. The cleanest market framing is that rated feeders are a visible, fast-growing subset supported by rating-agency data, while unrated feeders are a broader, long-standing access structure embedded across private funds, private wealth platforms and master-feeder arrangements.
The two figures below describe the overall private funds universe reported to the SEC. They are cited to size the ecosystem RFFs and UFFs sit within — they are not feeder-fund counts or feeder AUM and should not be read as such.
54,392
Private funds reported on Form PF, 2025 Q3 — a broad proxy, not a feeder-only count
$26.9T
Aggregate private fund gross asset value, 2025 Q3 — broad GAV, not feeder-only AUM
Why Feeder Funds Are Gaining Momentum
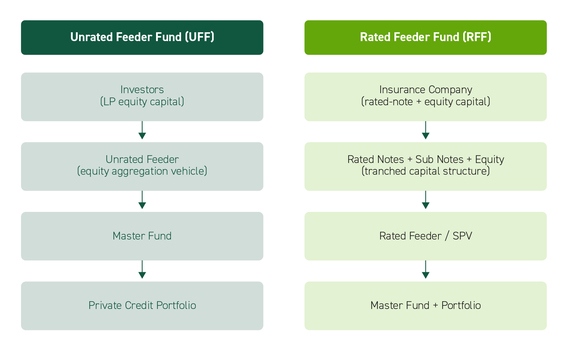
Private credit has become a major institutional asset class and continues to attract insurance-capital interest. Feeder fund structures connect different investor channels to a master fund. Traditional unrated feeders remain straightforward equity aggregation vehicles. Rated note feeders instead package exposure through rated debt and equity issued by a feeder vehicle that invests into the master fund.
For insurers, that distinction matters. Published legal and fund administration commentary describes RFFs as vehicles that issue rated notes to insurance company participants, with proceeds used to acquire interests in a main fund. When the notes qualify for favorable statutory treatment and receive an appropriate National Association of Insurance Commissioners (NAIC) designation, the structure can reduce required risk-based capital (RBC) relative to a direct equity interest in the main fund.
Feeder Fund Structures: Traditional Unrated Feeder vs. Rated Note Feeder
Regulatory Watch: Evolving NAIC RBC Frameworks
Recent regulatory action by the NAIC further emphasizes the shift toward granular, valuation-backed capital treatment:
- 2026 CLO C-1 Factor Updates (Proposal 2026-12-IRE): Effective for December 31, 2026 RBC filings, the NAIC adopted updated C-1 factors for CLOs and structured credit. Senior AAA tranches see charges drop to 0.036%, enhancing capital efficiency for top-tier debt, while lower-investment-grade or thin subordinated tranches face higher capital charges. Rated-note feeder structures must be modeled carefully against these tranche-specific thresholds.
- 2027 Collateral-Loan Valuation Framework: Effective December 31, 2027, the Life RBC Working Group approved an overcollateralization framework for collateral loans backed by fund/LP interests or residual tranches. While maintaining baseline charges of 30% to 45%, the framework allows insurers to cut capital requirements by up to 50% (down to 15% and 22.5%) — provided the insurer obtains independent third-party verification of the collateral’s fair value.
Insurance Company Economics: Illustrative RBC Math
For insurers, the core economic benefit is capital efficiency. A direct limited partner (LP) equity interest in a private fund is commonly treated as equity exposure. A rated note feeder can shift a significant portion of the same economic exposure into rated debt if the notes qualify for bond treatment and receive an NAIC designation. The illustration below uses a $100 commitment and published indicative ranges: traditional LP equity of approximately 30% to 45%, senior rated notes as low as approximately 0.3% to 2.0%*, and common 70/30 or 75/25 debt-to-equity structures.
|
Scenario |
$100 Mix |
RBC Factor* |
RBC Capital |
Reduction |
| Unrated Equity (Baseline) | $100 Equity | 45.0% | $45.00 | Base |
| Unrated Equity — Lower Case | $100 Equity | 30.0% | $30.00 | 33.3% Lower |
| Rated Feeder 75/25 — High | $75 Notes / $25 Equity | 2.0% Notes + 45.0% Equity | $12.75 | 71.7% Lower |
| Rated Feeder 75/25 — Low | $75 Notes / $25 Equity | 0.3% Notes + 45.0% Equity | $11.48 | 74.5% Lower |
| Rated Feeder 70/30 — High | $70 Notes / $30 Equity | 2.0% Notes + 45.0% Equity | $14.90 | 66.9% Lower |
| Rated Feeder 70/30 — Low | $70 Notes / $30 Equity | 0.3% Notes + 45.0% Equity | $13.71 | 69.5% Lower |
Math: direct equity = $100 × equity RBC factor. Rated feeder = (rated-note amount × note RBC factor) + (equity/residual amount × equity RBC factor).
Example: 75/25 at a 2.0% note charge and 45.0% equity charge = ($75 × 2.0%) + ($25 × 45.0%) = $1.50 + $11.25 = $12.75.
*Note: The 30.0% – 45.0% equity and 0.3% – 2.0% note factors serve as baseline indicative statutory ranges for general equity and senior/investment-grade bond treatment. Under newly adopted NAIC rules (Proposal 2026-12-IRE, effective Dec. 31, 2026), modeled C-1 factors for BSL CLO tranches will be more granular—ranging from 0.036% for AAA tranches to significantly higher charges for thin or lower-investment-grade tranches, while retaining the 45.0% base factor for residual/equity positions.
What Changes in the Rated Structure
|
Dimension |
Traditional/ |
Rated |
| Capital Format | Primarily equity capital | Debt notes plus equity/subordinated capital |
| Primary Insurance Benefit | Direct exposure; commonly treated as equity exposure | Designed to create rated debt exposure that can receive more favorable RBC treatment when requirements are satisfied |
| Valuation Perimeter | Underlying fund interest and portfolio NAV | Underlying fund interest plus note tranches, credit enhancement, waterfalls, liquidity assumptions and rating-agency support |
| Market Visibility | Broad and hard to isolate in public statistics | More visible through rating-agency issuance and transaction data |
The rated feeder does not eliminate private credit valuation risk; it reorganizes and amplifies the importance of getting valuation right. Market participants are not asking only what the mark is. They are asking whether the mark can be explained, calibrated, repeated, and defended when liquidity becomes constrained and observable pricing becomes scarce.
In a rated feeder fund, valuation professionals must address the underlying private credit assets, the fund interest, the rated notes, subordinated/equity pieces, credit enhancement, liquidity assumptions, cash-flow timing, structural leverage, note-to-value and other performance triggers, and waterfall mechanics — all within a package that auditors, rating agencies, boards and insurance investors review from different angles.
Performance Triggers Turn a Mark Into an Event
RFF note documents typically embed structural performance triggers that convert a valuation change into an automatic remedy, most commonly a note-to-value (NTV) test. This test is the exact image of a loan-to-value ratio, measured as the combined outstanding note(s) balance divided by the current fair value of the underlying collateral (the master fund interest, or the private credit assets themselves). Each tranche carries its own NTV threshold: loosest for the senior notes, given the subordination beneath them, and tightest for the most subordinated tranche, which has the least cushion against a decline in collateral value.
This is not a hypothetical construct — publicly rated general partner (GP)-led collateralized fund obligation (CFOs) use exactly this mechanic. KBRA's ratings on Alp CFO 2024, L.P. and Alp CFO 2025, L.P. set Class A/B/C advance rates at 50%, 65%, and 75% of collateral value, respectively — meaning the Class C notes carry only a 25-point valuation cushion before that test is breached.
The mechanics matter because the cushion a test provides can be thin. A junior note carrying an illustrative 85% NTV test, consistent with the deeper subordination seen in some structures, needs only a 15% decline in the fair value of the underlying collateral to breach. Once breached, the transaction documents typically redirect the waterfall: Distributions to equity and subordinated noteholders are suspended, and available cash is used to pay down or accelerate the affected tranche's principal until the test is restored to compliance. A breach on a senior tranche test, or a sustained failure to cure, can escalate to a full acceleration or early liquidation of the collateral pool.
| Tranche (Illustrative Cushion) |
Cushion |
Concentration to Breach: Full Write-off (100 to 0, Renovo-type) |
Concentration to Breach: 50% Haircut (100 to 50, Pluralsight-type) |
| Senior (50% advance rate) | 50 pts | 50% of pool | 100% of pool |
| Mezzanine (65% advance rate) | 35 pts | 35% of pool | 70% of pool |
| Junior (75% advance rate) | 25 pts | 25% of pool | 50% of pool |
| Deep junior (85% advance rate) | 15 pts | 15% of pool | 30% of pool |
Concentration required, at a given loss severity, to produce a pool-level decline equal to each tranche's cushion (concentration = cushion / loss severity).

Public BDC Data Provides a Useful Signal
BDCs provide a public window into private credit valuation because they disclose fair values quarterly. That transparency cuts both ways and lets outside observers test how consistently different managers value the same asset. This has produced two widely discussed episodes worth examining directly: Pluralsight and Renovo Home Partners.
Pluralsight and Renovo Home Partners are single-name loan positions inside diversified BDC portfolios that each hold dozens of credits, not the whole fund. A -44% or -100% move on one loan does not, by itself, move a diversified portfolio's NAV by anywhere near that amount; it is diluted across every other position in the pool. BlackRock TCP Capital and Golub Capital's GCRED are the BDCs themselves, the funds that hold those loans and report a fund-level NAV.
BlackRock TCP Capital's -19% figure is different in kind, as it is an actual one-quarter, whole-portfolio NAV decline, which is why it is the only case study plotted directly against the cushions above. A 19-point decline exceeds only the most subordinated, 85%-advance-rate tranche’s 15-point cushion in the table above; it does not reach the 25-point junior, the 35-point mezzanine, or the 50-point senior thresholds — illustrating how the same stress event can breach one tranche’s test while leaving more senior tranches fully covered. The relevant question for single-name stress like Pluralsight's or Renovo's is: How concentrated would that kind of stress need to be within the pool to move the aggregate collateral value by enough to breach a given tranche's test?
What the Cross-BDC Evidence Shows
KBRA's own review of its rated BDC portfolio, “Private Credit: BDC Portfolio Valuations Are Rigorous,” sampled loans held by multiple BDCs via a third-party market-data platform specifically to test whether isolated media reports of differing marks on the same loan support a broader claim that BDC valuations are unreliable. KBRA's conclusion was that they do not. Outlier cases exist, but they are the exception rather than the rule across the sample it reviewed.
The Pluralsight and Renovo cases below illustrate what those outliers can look like in practice.
Case 1: Pluralsight
Pluralsight's term loan is the most widely cited example of BDC mark dispersion. At year-end 2023, BDC marks on the loan ranged from 89 to 99 cents on the dollar. By March 31, 2024, the range had widened — Blue Owl Capital marked the position at roughly 83 cents while Golub Capital marked it at 97 cents, a roughly 14-point spread across seven KBRA-rated BDC lenders holding the position (a group that also included Ares, Goldman Sachs, Benefit Street Partners, BlackRock and Oaktree).
By June 2024, as Pluralsight approached restructuring, marks across BDCs fell to a 46-to-50-cent range, a roughly 44% drop in the average mark in a single quarter. The size and speed of that final move, not just the March dispersion, is the strongest evidence for the underlying point: quarterly marks can lag fast-moving credit deterioration.
Case 2: Renovo Home Partners
Public reporting is specific and severe. BlackRock had marked its roughly $150 million Renovo Home Partners loan at 100 cents on the dollar about a month before Renovo's Chapter 7 bankruptcy filing, then wrote the position down to zero — a complete loss — around the time of the filing. Apollo's MidCap Financial and Oaktree Capital also held Renovo debt. The episode renewed discussion in the private credit market about valuation governance, transparency, and the speed with which private-market marks reflect deteriorating credit conditions.
Why These Cases Go Beyond Simple Private Credit Stories
These examples do not establish that any specific manager's valuation process was incorrect. They demonstrate that illiquid assets and uneven information can produce materially different valuation conclusions, and that marks can move very quickly once a credit turns. Governance, calibration and documentation become more important as private credit grows.
The private credit liquidity discussion matters because illiquid loans have limited observable market evidence, infrequent trading, bespoke documentation and manager-specific information. During stress, those limitations can create wider valuation ranges and a greater need for independent support.
2026 Update: The Pattern Has Widened
Pluralsight and Renovo were not the end of the story. By the first half of 2026, dispersion had moved from isolated, headline-driving cases to a pattern visible across BDC quarterly disclosures and, in one case, to a gap between a fund's reported NAV and what the market would actually pay for it.
Markdowns Broadened Across the BDC Universe in Q1 2026
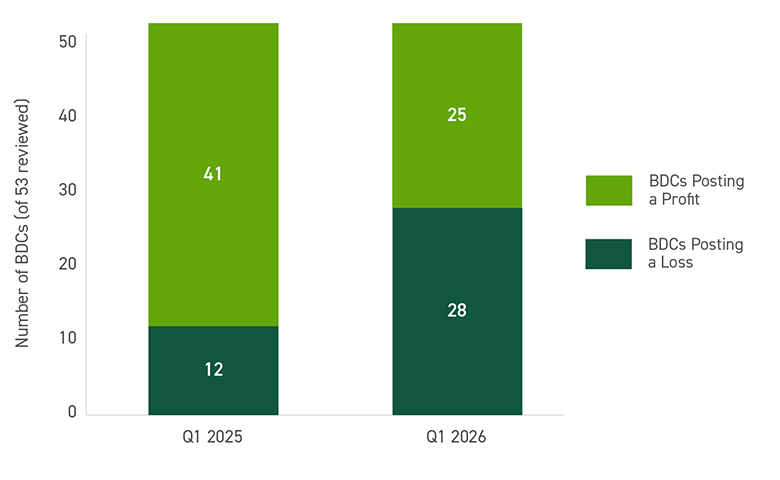
A Reuters review of 53 BDCs found 28 posted a loss in Q1 2026, up from 12 a year earlier. The group's average result swung from a $26 million profit to a $7.6 million loss, driven by loan write-downs, higher borrowing costs, and greater use of non-cash payment-in-kind income concentrated in software credits exposed to AI-driven disruption. Blue Owl's Technology Finance Corp (OTF) fund took a $490 million markdown, its largest since inception. FS KKR booked $195 million in realized losses, its second highest on record. Crescent Capital BDC recorded more than $12 million in losses, its worst since 2020.
BDCs Posting a Quarterly Loss
Golub Capital's non-traded BDC (GCRED) shows the same dynamic at a single-manager level. Per its own Q1 2026 investor report, NAV per share fell from $25.15 to $24.14 during the quarter as spreads widened across both middle-market and broadly syndicated loans. Golub attributes 65% of the decline to middle-market direct-lending markdowns and 32% to broadly syndicated loan markdowns, and states explicitly that the moves reflect market-level repricing rather than deteriorating borrower fundamentals — a useful reminder that a widening mark is not automatically a credit signal.
BlackRock's TCP Capital Corp. (TCPC) posted a sharper, more concentrated decline: NAV per share fell approximately 19%, from $8.71 to $7.07, in the quarter ended December 31, 2025, disclosed in a January 23, 2026, Form 8-K. Six positions drove roughly two-thirds of the decline, including HomeRenew — the entity doing business as Renovo Home Partners, the same credit discussed above, this time surfacing at a second lender. BlackRock waived one-third of the fund's management fee for the quarter.
Marks vs. Market Price: The Blue Owl Example
Blue Owl Capital Corporation (OBDC, listed) and Blue Owl Capital Corporation II (OBDC II, non-traded) announced a merger agreement on November 5, 2025, with OBDC as the surviving company. The merger was terminated two weeks later, on November 19, 2025, citing market volatility, after OBDC's own market price fell to roughly a 20% – 23% discount to its reported NAV, a discount that would have been passed on to OBDC II investors immediately had the merger closed as planned.
The gap widened further when OBDC traded near a 25% discount to NAV by late April 2026. OBDC II's board separately committed to returning 50% or more of net assets to shareholders in 2026, including a 30% return-of-capital distribution at NAV due by March 31, 2026. In March 2026, outside firms Cox Capital Partners and Saba Capital Management launched an unsolicited tender offer for a minority stake in OBDC II at roughly a 33% – 35% discount to NAV; OBDC II's board unanimously recommended shareholders reject it, backed by a fairness opinion from BofA Securities. The episode is a concrete illustration of a reported NAV being tested against an instant-liquidity price, causing the two to diverge sharply.
Regulators Are Now Asking the Same Question
On June 3, 2026, U.S. Attorney for the Southern District of New York (SDNY) and former SEC Chair Jay Clayton, told the Bloomberg Global Credit Forum that he has directed SDNY prosecutors to scrutinize valuation discrepancies and outlier marks in private credit. Clayton said the gap between how the same or similar assets are marked on different balance sheets was central to the blowups at First Brands Group, Tricolor Holdings, and 777 Partners, and flagged particular concern where valuation practices affect fee generation. His comments mark a shift in emphasis, considering SDNY's prior private-credit enforcement centered on borrower-side fraud. The regulatory landscape is explicitly endorsing this concern. Under the NAIC's 2027 collateral-loan framework, obtaining independent, audit-ready third-party valuation verification isn't just a risk-management best practice — it is the explicit regulatory requirement for insurers seeking up to 50% in RBC capital relief.
For rated and unrated feeder funds, this development raises the stakes. A defensible, independent, and well-documented valuation process is no longer only an investor-confidence consideration. A sitting U.S. Attorney has stated publicly that his office is examining valuation discrepancies and outlier marks directly.
Why Qualified Independent Valuation Advisors Matter Now
Selecting a valuation advisor is a governance decision as much as a technical one. Six capabilities separate a defensible valuation process from a reported number:
- Independence: Objective perspective separate from fund management incentives
- Audit-ready Support: Workpapers, assumption tracking and documentation for auditor review
- Calibration Discipline: Methodology connecting initial transaction economics to current credit performance and market inputs
- Rating Agency Readiness: Support for rated note economics, coverage, cash flow, note-to-value trigger and waterfall sensitivities
- Investor Confidence: Clearer reporting for insurance investment teams, boards and LPs
- Scalable Governance: A process that evolves as portfolios and valuation frequency increase
Independent Valuation as the Shared Confidence Layer Across Stakeholders
For rated and unrated feeder funds alike, the need is a defensible process: properly calibrated, consistently applied, clearly documented, and understandable to auditors, boards, investors and rating agencies. A qualified independent valuation advisor can make the difference between a mark that is merely reported and a valuation conclusion that is ready to be challenged.
In today's private credit market, the value of independence is every bit as important as the value being measured.
Let Us Guide You Forward
Cherry Bekaert views the next phase of private credit growth as a credibility test. While capital formation remains important, valuation confidence will increasingly determine which managers raise capital, retain investors and withstand scrutiny through less liquid periods.
Cherry Bekaert‘s Valuation practice serves investment funds across all asset classes and their portfolio companies, including monthly and quarterly valuation services for private and structured credit, broadly syndicated loan (BSL) or private credit collateralized loan obligations (CLOs), rated feeder funds, private-asset backed securities (ABS) and other less liquid or bespoke investments. Our clients are highly focused on middle market investment strategies, investing from multiple generations of funds, and across various asset classes.
Our team provides fair value reporting services that satisfy the requirements of FASB’s ASC 820 and other financial reporting standards. Using a flexible, business-practical approach, we work seamlessly with lending teams and their desired processes while maintaining the integrity of our analysis, helping them determine and report on alternative investments’ performance. Connect with an advisor today to learn more about our comprehensive offerings.