


The insurance industry enters the second half of 2026 from a position of unusual strength — and unusual complexity. The U.S. property and casualty sector posted its best underwriting results in more than a decade in 2025; capital positions across the industry are robust, and buyers of insurance are finally seeing meaningful rate relief after years of hard-market conditions. Yet nearly every tailwind that produced those results is now fading.
Pricing is softening across most commercial lines, reserve releases are normalizing, favorable catastrophe experience is unlikely to repeat, and the legal environment surrounding liability claims shows no sign of cooling, especially in certain states and jurisdictions. At the same time, the structure of the industry itself is being redrawn: consolidation is reshaping distribution and carrier landscapes, alternative capital continues to blur the line between insurance and asset management, and a growing share of corporate risk is migrating out of the traditional market entirely and into captive structures.
The insurance industry enters the second half of 2026 at an important inflection point. Strong underwriting performance, abundant capital, and favorable operating conditions have given way to a market increasingly shaped by strategic, regulatory and economic complexity. This report examines five forces defining the current insurance landscape: the evolving shape of consolidation and M&A activity, the rise of captive insurance as a growing strategic alternative for some insureds, the macroeconomic pressures weighing on profitability, a regulatory and tax landscape in genuine flux, and the near-term outlook as the industry navigates the transition from an exceptional 2025 into a period requiring greater discipline, selectivity and execution.
Key Findings
- The market’s tailwinds are fading together: pricing is softening, reserve releases are normalizing, and favorable catastrophe experience is unlikely to repeat.
- M&A has grown selective rather than slow, with capital concentrating in fewer, larger and more deliberate transactions.
- The brokerage roll-up model is maturing as rate-driven organic growth moderates, though the long-run supply of independent agencies remains substantial.
- Captive insurance has moved from a tax vehicle to core capital strategy, even as the micro-captive compliance environment remains unsettled.
- Social inflation, elevated catastrophe exposure and a narrowing investment income tailwind leave less margin for error.
- Discipline is the differentiator: in underwriting as pricing softens; in diligence as selectivity rises; and in governance as captives and AI draw scrutiny.
Consolidation and M&A: Fewer Deals, Bigger Bets
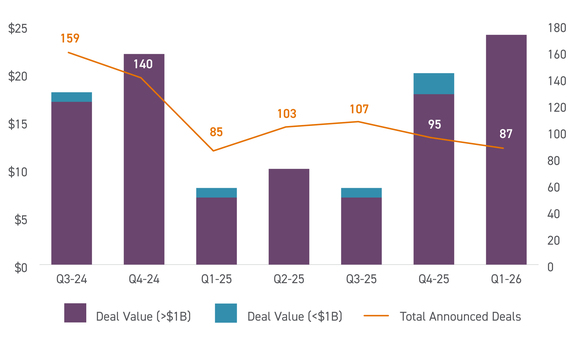
Insurance M&A in 2026 is best described as selective rather than slow. Announced deal value across the sector reached approximately $24.3 billion across 87 disclosed transactions in the first three months of 2026. But the composition of that activity tells the more important story: Nearly all of the disclosed value in Q1 2026 was concentrated in megadeals, signaling that while the volume of transactions has cooled, strategic conviction at the top of the market remains strong.
U.S. Insurance M&A Deal Activity
Source: S&P Global Market Intelligence | As of March 31, 2026
The marquee transaction of the year to date is the roughly $22 billion merger of Corebridge Financial and Equitable Holdings, announced in March 2026 — a combination of two scaled retirement, life insurance, and wealth management platforms with approximately $1.5 trillion in combined assets under management and administration, and one of the largest strategic combinations the life and retirement sector has seen in years.
It follows a string of significant deals over the winter, including Willis Towers Watson’s $1.45 billion acquisition of tech-enabled broker Newfront, Howard Hughes Holdings’ $2.1 billion purchase of Bermuda reinsurer Vantage Group from Carlyle and Hellman & Friedman, and Enstar Group’s $1.59 billion carve-out acquisition of workers’ compensation specialist Accident Fund Holdings from Blue Cross Blue Shield of Michigan.
The concentration of deal value among a handful of large transactions underscores a broader trend: Capital remains readily available for high-quality insurance assets, but buyers are becoming increasingly selective about where and how they deploy it.
Private Capital Remains Committed, but More Discriminating
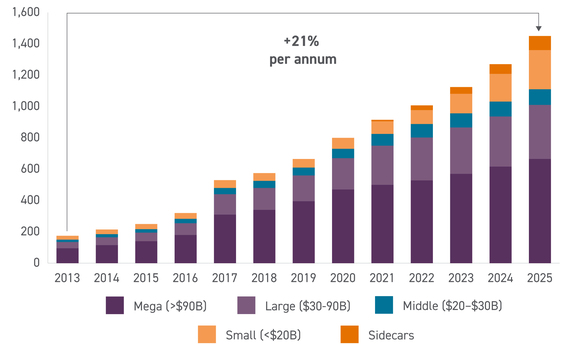
Private equity (PE) and alternative asset managers remain the most consistent buyers in the sector, accounting for roughly 71% of announced insurance distribution transactions in 2025. The strategic logic has not changed: insurance offers recurring, capital-light fee streams on the distribution side and long-dated, permanent capital on the carrier side.
The sponsor-insurer convergence model pioneered by Apollo and Athene and by KKR and Global Atlantic continues to expand, with alternative managers pursuing life and annuity platforms, asset-intensive reinsurance transactions, and block acquisitions to secure stable liability origination alongside scalable asset management mandates. Recent announcements — including Aquarian Holdings’ acquisition of Brighthouse Financial and large reinsurance transactions such as RGA’s deal with Equitable — underscore the continued demand for U.S. insurance platforms and liability portfolios among private capital and strategic investors.
Assets Held By Private-capital-backed Insurers
Source: S&P Global Market Intelligence | As of July 2026
What has changed is selectivity. Specialty property and casualty carriers, managing general agents, fronting carriers and excess and surplus lines businesses are attracting the strongest interest, supported by improved combined ratios and premium growth that continues to outpace the admitted market. Underwriting quality, not simply platform scale, is increasingly the gating factor in diligence.
“Capital hasn’t lost its appetite for insurance. It’s just gotten much more particular about what it’s paying for. The platforms earning premium valuations today are the ones that can show underwriting discipline in a softening market, not just the growth they rode in on during a hard one.”

The Brokerage Roll-up Model Is Maturing
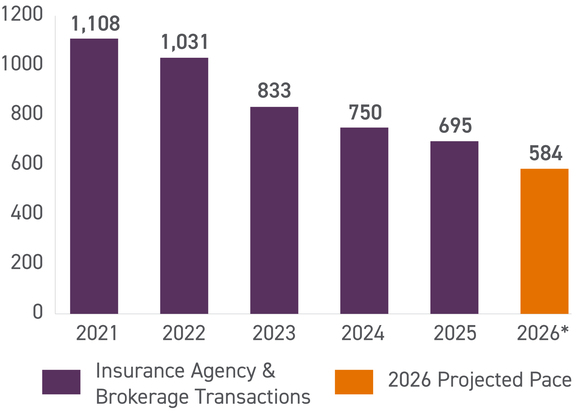
The most notable cooling has come in insurance distribution, where the decade-long agency roll-up boom appears to be bottoming out. The sector recorded 148 announced agent and broker roll-ups in the first quarter of 2026 — the lowest first-quarter total since 2016 and roughly 16% below the fiveyear average — with trailing 12 month volume of 686 deals, well off the 2021 peak of more than 1,100.
Insurance Agency M&A Activity
Source: OPTIS Partners | As of July 2026
Several of the most prolific historical acquirers have pulled back meaningfully. The drivers are structural, as premium rate increases have moderated from 2022–2024 levels, slowing brokers’ organic growth; distributor valuations have compressed; and the arbitrage between private acquisition multiples and public platform valuations that fueled the roll-up model has narrowed.
Layered over all of this is genuine uncertainty about whether artificial intelligence (AI) will allow new entrants to undercut traditional commission structures or, conversely, allow incumbents to expand margins through operating leverage—a debate that is actively repricing brokerage assets.
The long-term consolidation opportunity remains significant, with an estimated 25,000 to 30,000 mostly small agencies still operating independently. As a result, a new generation of technology-enabled acquirers is emerging to pursue smaller targets, while PE-backed and hybrid buyers continue to account for the majority of market activity, representing roughly three-quarters of announced transactions over the past year and 80% of deals closed in Q2 2026, according to Insurance Business.
Captive Insurance: From Tax Vehicle to Strategic Imperative
Perhaps no corner of the industry has undergone a more meaningful repositioning than captive insurance. For decades, captives — insurance subsidiaries formed by an organization to insure its own risks — were viewed primarily as a niche alternative or, in the case of small captives, a tax-planning device. In 2026, they have moved decisively into the mainstream of corporate risk and capital strategy. Years of hard-market pricing, shrinking capacity in difficult lines, and rising retentions pushed risk managers to take greater control of their own programs, and the discipline built during that period is now paying dividends.
The most sophisticated captives today are embedded in enterprise strategy, supporting long-term capital allocation and volatility management rather than chasing short-term premium savings. Carriers themselves have taken notice: as pricing normalizes across the P&C market, insurers are leaning on captive reinsurance structures, sidecars and alternative capital partnerships as core capital-optimization tools.
The regulatory environment is reinforcing the trend. New and newly competitive domiciles continue to emerge — France implemented captive-friendly tax and accounting rules, the United Kingdom is developing a dedicated captive regime, and U.S. states such as Oklahoma have positioned themselves as growth domiciles alongside established leaders. Jurisdictional competition is, on balance, improving the credibility and professionalism of the captive market.
Tax Legislation Is Quietly Redrawing the Captive Opportunity
P.L. 119-21, or the “One Big Beautiful Bill Act” (OBBBA), contains little that targets captives directly, but its downstream effects on captive strategy are substantial. The legislation’s expansion of Health Savings Account eligibility beyond high-deductible plans, together with increased contribution limits of $4,400 for individuals and $8,750 for families, builds larger pools of tax-advantaged healthcare capital that captive programs can be designed to complement. Its reinforcement of ERISA’s federal preemption of state benefit mandates gives self-funded employers greater latitude to design customized plans — a direct opening for medical stop-loss captives. And with the legislation reducing federal Medicaid funding by an estimated $1 trillion over ten years, demand for self-funded alternatives is widely expected to grow.
For middle-market employers confronting persistent healthcare cost inflation, these developments may strengthen the case for evaluating captive and other alternative risk-financing structures. More broadly, they illustrate how legislative and regulatory changes continue to reshape the risk-financing landscape, creating both opportunities and strategic considerations for organizations seeking greater control over cost, volatility and long-term risk management.
The Micro-captive Rules Remain a Moving Target
For smaller captives electing under Section 831(b) — which allows qualifying captives to exclude underwriting income from federal tax, subject to a premium cap the IRS raised to $2.9 million for 2026 — the compliance landscape is genuinely unsettled. In March 2026, a federal district court in Tennessee upheld the IRS’s final rule designating certain micro-captive arrangements as listed transactions and transactions of interest, validating the agency’s authority to impose heightened reporting on structures exhibiting hallmarks of tax avoidance. Weeks later, in April 2026, a federal district court in Texas vacated portions of the same rule, holding that the IRS had not adequately supported its presumption that the targeted arrangements were abusive. With conflicting rulings now on the books and further litigation pending, businesses operating or contemplating 831(b) captives face a period of real uncertainty.
The IRS has long been concerned that some taxpayers have used Section 831(b) micro-captives to avoid or evade federal income taxes. IRS scrutiny of micro-captive transactions is not going away anytime soon. The practical guidance, however, is stable: courts have consistently upheld captives that demonstrate genuine risk transfer, adequate risk distribution, actuarially sound premium pricing, and operation as a bona fide insurance company — and have consistently struck down those that do not. Documentation, governance and economic substance are the dividing line, and organizations with well-run captives should view the enforcement environment as clarifying rather than threatening.
“Conflicting court decisions make headlines, but they don’t change the fundamentals. Captives with genuine risk transfer, actuarially sound premiums and real insurance operations have held up for decades. If you own an 831(b) captive, now is the time to revisit your documentation.”

Macroeconomic Pressures: Profitable, but Less Forgiving
The industry’s financial results heading into 2026 were historically strong. Favorable underwriting conditions, strong capital levels and robust investment performance drove one of the most profitable periods the sector has experienced in more than a decade.
The U.S. property and casualty (P&C) sector posted a full-year 2025 combined ratio of approximately 92%, according to insurance data analytics company Verisk, marking before the best underwriting result in more than 10 years, This result was aided by a benign Atlantic hurricane season, exceptional private auto profitability following 30 consecutive quarters of rate increases, and roughly $18 billion of favorable reserve releases through the first nine months of the year, nearly double the prior-year pace. Policyholder surplus has swelled 24% over three years to approximately $1.2 trillion, giving the industry a substantial cushion against shocks.
The consensus view is that 2026 will remain profitable but noticeably less flashy. Rating agencies project the industry combined ratio to rise to the 96–97% range as hurricane experience reverts toward trend and reserve development normalizes, with adjusted return on surplus slipping from roughly 10.1% in 2025 to about 9.1% in 2026. Premium growth is decelerating toward 3–4% across lines, down from the 9–10% pace of the hard-market years, as expanded capacity and improved results invite competition — most visibly in personal auto, where carriers have sharply increased advertising spending in a renewed battle for market share, and in commercial property, where rates declined for the first time since 2017 and shared and layered placements have seen decreases of 10–30% against expiring terms.
Three pressures deserve particular attention. The first is social inflation, which remains the industry’s most stubborn structural challenge. Larger jury verdicts, expanding settlement values and the growth of litigation finance continue to drive claims severity higher across commercial auto, general liability and umbrella lines; general liability loss ratios in late 2025 were among the worst in decades, and U.S. insurers have absorbed roughly $62 billion of adverse development in commercial liability lines over the past ten years.
The second is catastrophe exposure, which has become structurally elevated even in ostensibly quiet years. Global insured catastrophe losses reached an estimated $107 billion in 2025 despite the absence of a major U.S. hurricane landfall, with wildfires and severe convective storms — so-called secondary perils once treated as attritional — accounting for more than $50 billion for the third consecutive year.
The third is the investment income picture. With the Federal Reserve having begun easing, the gap between new-money yields and existing portfolio yields is narrowing, slowing the growth in net investment income that cushioned underwriting volatility through the rate-hiking cycle.
Tariff-driven cost inflation in auto parts and construction materials adds a further layer of loss-cost uncertainty, particularly for personal lines.

Insurer Investment Portfolios: Bonds Cede Ground to Equities
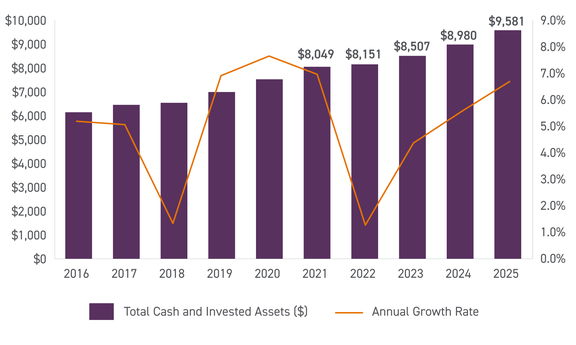
Insurers’ own investment portfolios are undergoing a parallel, quieter shift. Total cash and invested assets across the industry grew 6.7% to $9.6 trillion in 2025, the fastest pace of growth in four years, but the composition of that pool continues to move away from traditional fixed income. Bonds fell to 59.8% of the portfolio — below 60% for the first time on record — down roughly 10 percentage points from around 70% in 2010, even as the dollar value of bond holdings still rose 5.6% to $5.7 trillion. Common stocks, by contrast, grew 11.2% to $1.3 trillion, lifting their share of the portfolio to 13.6% from 13.1% the year before and reinforcing their position as the industry’s second-largest asset class, according to a report published by the National Association of Insurance Commissioners (NAIC).
U.S. Insurance Industry Total Cash and Invested Assets
Source: NAIC | As of July 2026
The reallocation is concentrated almost entirely on the P&C side of the ledger. P&C carriers held 77% of the industry’s total common stock exposure and carried common stocks at roughly 32% of their own portfolios, about half of its affiliated holdings, reflecting the traditional use of equities to enhance returns against shorter-duration liabilities. Life insurers, whose liabilities run decades rather than years, held common stocks at just 4% of their portfolios and remain committed to bonds, mortgage loans and other long-duration credit assets that better match their obligations. That divergence bears on the nearterm outlook. With the Fed easing and new-money yields converging toward back-book yields, the fixed-income side of the balance sheet is a smaller tailwind to earnings than it was a year ago, and carriers with the flexibility to lean into equities and alternative assets — Schedule BA holdings rose 10.5% for the year — have more room to offset that pressure than carriers whose allocation is dictated by long-tail liability matching.
The Regulatory and Policy Landscape
Regulation continues to reshape the industry on multiple fronts. At the federal level, the tax and healthcare provisions of the OBBBA discussed above represent the most consequential legislative development for the risk-financing market in years, even though the insurance industry was not its direct target. Meanwhile, the IRS’s micro-captive enforcement program and the conflicting court decisions it has generated will remain a defining compliance issue through at least the end of 2026, with the pending litigation likely to influence the agency’s authority to regulate through reportable-transaction designations in the post-Loper Bright environment.
At the state level, a quiet structural consolidation of financial regulation is underway. North Dakota has merged its insurance and securities departments, and more than a dozen other states have taken similar steps — a trend that could reduce regulatory fragmentation, streamline licensing and improve coordination, particularly for captive managers and multi-state operators. Tort reform has also become a live legislative front: Proposals across multiple states to rein in litigation finance aim directly at the social inflation problem, though any relief will take years to flow through to loss ratios.
Internationally, regulatory change is actively shaping deal flow. Revisions to Solvency II are expected to spur further consolidation among European carriers, while the phased adoption of risk-based capital regimes across Asia is raising capital requirements for local insurers and driving demand for reinsurance solutions and divestitures. India’s decision to lift its foreign direct investment cap on insurers from 74% to 100% opens the door to full acquisitions in one of the world’s fastest-growing markets. And across every jurisdiction, AI governance is emerging as the next regulatory frontier, as supervisors begin scrutinizing algorithmic underwriting, claims automation and the data integrity underpinning both — an area where insurers that move early on model governance will hold a durable compliance advantage.
Near-term Insurance Industry Outlook: Discipline as the Differentiator
The outlook for the balance of 2026 and into 2027 is best characterized as balanced rather than exuberant. Underwriting profitability should hold, but the era of exceptional results is giving way to a period of normalization, with forecasters expecting returns on equity to stabilize near 10% even as combined ratios drift upward. The pricing cycle has clearly turned in buyers’ favor across property and much of the commercial market, while casualty lines remain the industry’s watch item — reserve adequacy in long-tail liability business is the most significant structural risk on carrier balance sheets, and the industry’s ability to maintain pricing discipline amid persistent social inflation will likely differentiate market leaders from the broader field.
Insurance carrier M&A activity is widely expected to accelerate rather than retreat. Excess capital, easing interest rates, and the strategic imperative to acquire technology and specialty capabilities all point toward a busier deal environment in the second half of 2026 and into 2027, with insurers pursuing targeted, capital-efficient transactions — bolt-on specialty acquisitions, carve-outs of non-core blocks, and AI and analytics capabilities — rather than transformational bets. In a still deeply fragmented market, acquirers with programmatic M&A capabilities and disciplined integration playbooks have demonstrably outperformed, and that gap is likely to widen.
AI, meanwhile, is transitioning from pilot programs to operational backbone. Early adopters of AI-enabled claims and underwriting platforms are reporting reductions in claims cycle times exceeding 40% and material gains in underwriting efficiency, and carriers broadly view the technology as an opportunity even as brokers wrestle with its implications for the commission model. The competitive question for the next several years is less whether to adopt these tools than whether organizations can pair them with the data quality, change management and governance required to deploy them safely.
For organizations rethinking how they finance risk, the common thread across all five of these trends is discipline:
- Discipline in underwriting as pricing softens.
- Discipline in diligence as deal selectivity rises.
- Discipline in governance and risk management as captive structures, data usage, and artificial intelligence face increasing scrutiny.
The industry has earned its strong position; sustaining it will require the same discipline, adaptability and execution that created it.
How Cherry Bekaert’s Insurance Team Can Help
Cherry Bekaert’s professionals advise insurance organizations, carriers, brokers, PE sponsors evaluating insurance platforms and middle-market businesses across the full spectrum of issues discussed in this report — from transaction advisory and quality of earnings for insurance-sector deals, to captive feasibility, structuring and tax compliance, to risk, regulatory and technology strategy. To discuss how these trends affect your organization, contact our team.