


After a rebound year in 2025, private equity (PE) entered 2026 with genuine optimism, and the first quarter did nothing to dispel it. The second quarter, however, did.
Three forces converged on U.S. private equity in a single quarter: a Federal Reserve signaling it would hold rates steady against a market that entered the year expecting cuts, an energy-driven inflation shock tied to the conflict in Iran, and the growing need to underwrite AI risk across both new targets and existing portfolios. The combined effect of these forces is evident in the size of deals, not deal count.
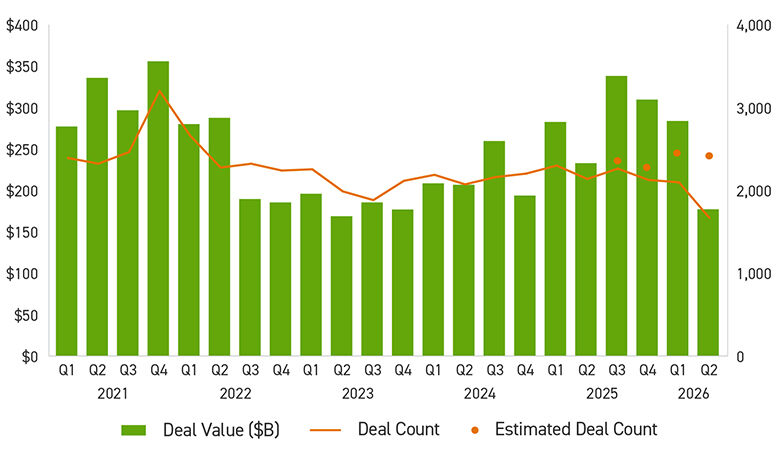
Sponsors closed an estimated 2,384 deals in the quarter, essentially flat against the first quarter and 11.5% ahead of the same period last year. While activity did not stop, deal size shrank. The decline was concentrated at the top of the market, as sponsors retreated from the large, financing-dependent transactions that move the value needle, even as smaller deals kept closing at a steady pace.
Private Equity Deal Activity by Quarter ($B)
PitchBook | Geography: U.S.
As of June 30, 2026
That divergence — a stable deal count against collapsing aggregate value — points to a repricing of size, rather than a retreat from activity. Year to date, U.S. sponsors have deployed $461 billion, down 10.6% from the $515.5 billion put to work in the first half of 2025 and far off the $647.8 billion pace of last year’s second half. This gap was created primarily because dealmakers were reluctant to underwrite large transactions but continued to support small and middle market investments.
Individually, none of the three forces was unfamiliar. The Fed’s decision to hold, confirmed at its July meeting, was a disappointment rather than a surprise; sponsors have underwritten through higher-for-longer before. Energy-driven inflation is a variable most portfolio models already accommodate. However, artificial intelligence (AI) is a newer complication, and buyers are being asked to underwrite terminal value in businesses whose competitive position may be rewritten well inside a standard hold period — difficult to price, and harder still to defend to an investment committee. Arriving together, they compounded. Each widened the valuation gap on its own terms, and the market cleared at a fraction of its recent aggregate value.
“Each of the three shocks landed on the same question: what is this business worth when we sell it. Sponsors have underwritten through higher-for-longer before. What they have not had to underwrite is a competitive position that AI can rewrite inside the hold period. So, sponsors moved to what they could price.”
Software Investments Decline, Energy Infrastructure Surges
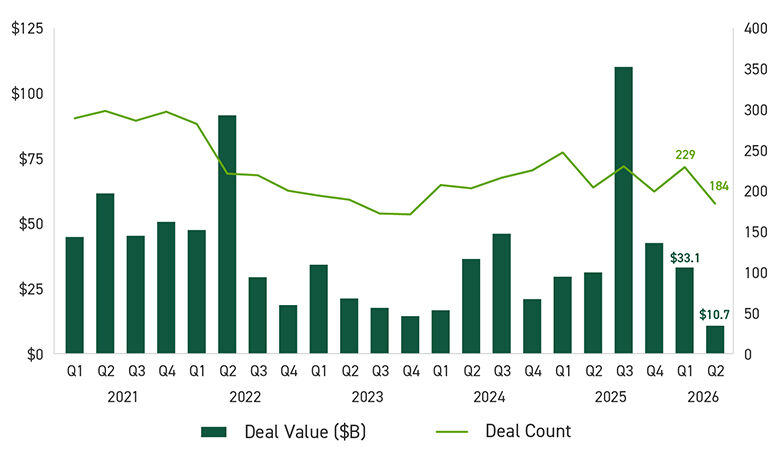
Nowhere is the reassessment clearer than in the sector that anchored PE returns for a decade. Software deal value fell to an estimated $10.7 billion in the quarter, down 65.7% year over year and 90.3% below its peak three quarters earlier. A sector that sponsors could not buy enough of in 2025 has become, by allocation behavior, one they are actively trimming.
Software Private Equity Deal Activity by Quarter ($B)
PitchBook | Geography: U.S.
As of June 30, 2026
The very AI build-out that threatens software is also powering the quarter's most durable sector. Energy deal value rose 80.5% year-to-date against the first half of 2025, and this is no commodity trade. Instead, the rise reflects structural demand. With hyperscaler (Alphabet, Amazon, Meta, Microsoft, and Oracle) capital expenditure projected near $690 billion in 2026, according to Futurum Group, power — not capital — has become the binding constraint on datacenter development. The artificial intelligence layer that is hollowing out software valuations is simultaneously rebuilding the investment case for the physical infrastructure that feeds it. Sponsors have noticed, and they are rotating accordingly.
“The bottleneck for AI stopped being models and started being megawatts. Capital followed it. What that means for sponsors is that the most attractive assets in this market don’t look like technology assets at all — they look like power, land and long-dated contracts.”
Both sides of that trade showed up in the handful of megadeals (transactions with enterprise values exceeding $1 billion) that did clear. The quarter's standout was the roughly $10 billion launch of Helix Digital Infrastructure, formed by PE firm KKR, the Kuwait Investment Authority, NVIDIA, and Vistra. This partnership is a direct, unhedged expression of the datacenter thesis.
Additionally, Stonepeak and Bernhard Capital Partners anchored the energy leg with their roughly $6 billion buyout of Cleco, moving a regulated Louisiana utility into sponsor hands precisely because datacenter load growth has recast it as AI infrastructure. CVC bought IFF's carved-out Food Ingredients business for $3.9 billion in net cash proceeds backed by $430 million in 2025 EBITDA and added a stable, cash-generative manufacturer to the portfolio.
The fourth notable megadeal deserves particular attention from anyone in professional services. KKR disclosed a roughly $3 billion buyout of Crowe, announced in June and projected to close in the third quarter, extending the sponsor push into accounting and advisory, a sector where recurring revenue and sticky client relationships hold their value better in current market conditions. In a quarter when sponsors abandoned large, financing-dependent transactions almost entirely, a top 10 U.S. accounting firm was one of only five deals with a transaction value above $2.5 billion. That is a statement about how the market now underwrites the economics of professional service firms.
Sponsors Moved Down Market, Not to the Sidelines
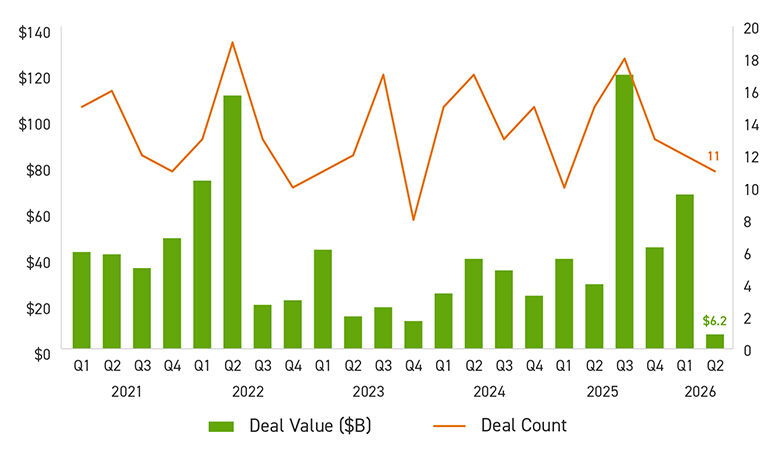
While the large-cap engine that carried 2025 effectively stalled, the middle market remained active. Deals above $2.5 billion generated just $25.9 billion across five transactions, down 59.7% year over year in value and 81.9% below the peak set three quarters earlier, with count nearly halved. Take-privates fell in step: public-to-private value dropped to $6.2 billion across 11 deals, a 90.1% quarterly decline. With public markets reaching new highs, sponsors are underwriting listed targets with unusual caution.
Private Equity Take-private Deal Activity ($B)
PitchBook | Geography: U.S.
As of June 30, 2026
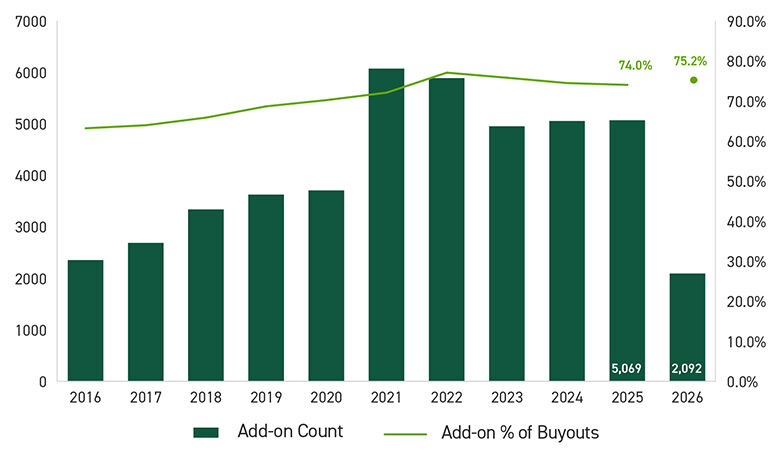
Smaller and safer transactions replaced that activity. Add-ons dominated at an estimated 885 transactions — three-quarters of all buyout activity — even as count fell 31.2% year over year and value dropped 44.5% to $52.6 billion. Platform count dropped 34% to 289, as sponsors bolted assets onto companies they already owned rather than underwriting new platforms demanding fresh leverage and full diligence. Growth and expansion investments were the only segment to grow, rising 19.1% year over year to an estimated 493 deals.
Add-ons as a Share of All U.S. Private Equity Buyouts
PitchBook | Geography: U.S.
As of June 30, 2026
Read together, these figures describe risk repricing rather than a surrender in the face of macroeconomic shocks. Capital flowed toward smaller, minority, and buy-and-build structures carrying less debt and less execution risk. Record dry powder — roughly $1.07 trillion as of the third quarter of 2025 — has not gone anywhere and is waiting on a credit path it can underwrite.
“While the exit window remains narrow, sponsors are building inside their portfolios and relying on smaller checks, lighter leverage and value created through operations and integration. The funds that fare well during this period will be the ones whose buy-and-build programs actually deliver the synergies underwritten at signing.”
Carve-outs Remain a Stabilizing Force
Corporate carve-outs have moved from opportunistic to central, and they may be the single most reliable source of deal flow in 2026. A reported 71% of private equity firms would pursue carve-out transactions, while 57% of corporates are open to or actively exploring business unit divestitures. As companies shed non-core divisions to sharpen focus and repair balance sheets, U.S. break-up activity reached roughly $725 billion by the middle of 2025, according to a report published by GrowthShuttle — up nearly 48% on the prior year's pace.
“Nothing is generating deal flow like carve-outs, and nothing punishes a thin diligence process faster. You’re buying financials that describe a business which doesn’t exist yet, with TSAs on someone else’s timeline and stranded costs that appear after close. The winners here aren’t underwriting an asset — they’re underwriting a separation.”
The forces driving this corporate streamlining are secular rather than cyclical. Higher capital costs make capital-intensive divisions more expensive to hold; AI and digital platform economics are forcing strategic reassessments; activist pressure and regulatory fragmentation push boards toward focus; and limited organic growth at scale makes divestiture a faster route to value than transformation. For sponsors, carve-outs are attractive because the complexity of separating a division from its parent tends to thin the field of bidders, often supporting more favorable entry pricing and meaningful operational upside.
Recent transactions underscore the theme. Franchise Equity Partners’ $472 million move for IMO Car Wash — Driven Brands’ international car wash business — and Brookfield Asset Management’s $900 million acquisition of corrugated packaging machinery manufacturer Fosber Group both show sponsors will take on complex separations when the asset is large and ripe for transformation. That complexity is the catch. Carve-outs are operationally demanding — transition service agreements, stranded costs, and standalone systems can span six to 18 months and thousands of interdependent workstreams — which is exactly where disciplined diligence and separation planning determine whether trapped value is unlocked.

Exits Are the Binding Constraint
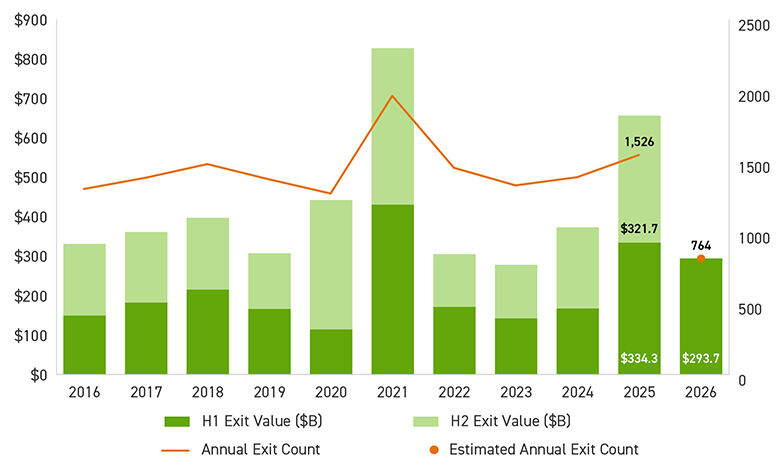
If the deal slowdown highlighted a demand problem, the exit slowdown underscored a deeper liquidity challenge.
U.S. Private Equity Exit Activity ($B)
PitchBook | Geography: U.S.
As of June 30, 2026
Exit value fell to $102.6 billion in the second quarter, down 46.3% sequentially and 7.4% year over year, while exit count dropped 14.1% to 353, remaining 5.4% ahead of the prior year. Year to date, the contraction is shallower than the quarterly figures suggest: $293.7 billion of first-half realizations ran roughly 12% behind the comparable 2025 window. A stronger first quarter cushioned a difficult six months.
Mega-exits of $1 billion or more totaled $63.2 billion across 23 transactions, anchoring more than 61% of quarterly exit value. Premium assets can still clear at scale when almost nothing else can, and the backlog behind these assets continues to build, with PE-backed company inventory reaching 13,509 businesses as of the second quarter.
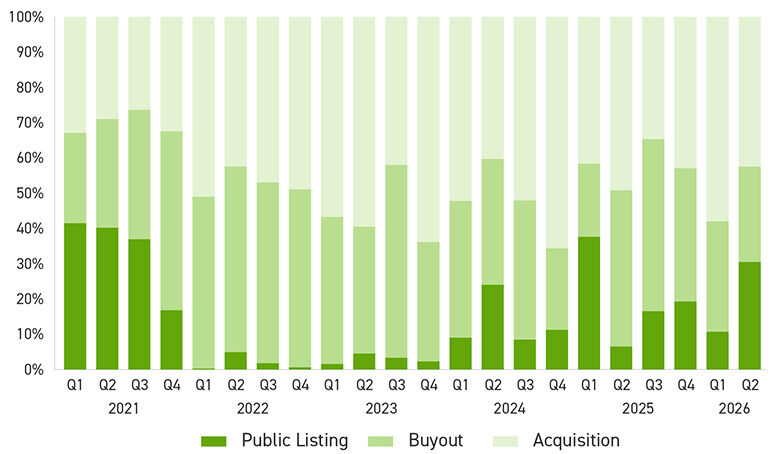
The public window created a lone bright spot in the first half of 2026, one that opened narrowly as initial public offering (IPO) value rose 42.2% sequentially to $27.6 billion, with the count doubling to 12. But it is important to note the 283.1% year-over-year jump measures growth off a depressed 2025 trough, not a march toward any historical high. Listings skewed toward B2B, industrials and aerospace. Arcline's listing of aerospace manufacturer Arxis at a $10.2 billion valuation was the largest, followed by natural gas generator distributor ERock at roughly $4.1 billion. Blackstone-backed Liftoff Mobile, an AI-powered mobile marketing platform, at $3.4 billion.
Every other channel moved the opposite way. Corporate acquisitions, still the largest exit route at $38.5 billion, fell 63.5% quarter over quarter. Sponsor-to-sponsor buyouts dropped 57% to $24.5 billion. The net effect pushed public listings from a high-single-digit share of exit value to 30.5% of the quarterly total and lifted the median IPO from $1.7 billion at the end of 2025 to $2.8 billion — the largest median among the three routes, and a reminder that the window is open primarily to scaled, premium assets.
Quarterly Share of U.S. Private Equity Exit Value by Type
PitchBook | Geography: U.S.
As of June 30, 2026
Sector concentration was extraordinary. B2B assets generated $40.6 billion of exit value, roughly 45% of all realizations and nearly double the sector's 25.9% five-year average, against $10.3 billion for healthcare and $8.9 billion for information technology (IT). Year to date, B2B exit value of $126 billion runs 144.6% above the first half of 2025 while IT and healthcare exits have fallen 77.1% and 35.8%, respectively. Energy was the only sector to grow in both count and value — 14 exits worth $13.5 billion — as strategics bought cash-generative assets to shore up position amid volatility and datacenter demand. The $1.6 billion sale of Brazos Midstream to Western Midstream Partners and the $1.3 billion sale of EagleRidge Energy to Marubeni reiterate the pattern of capital exiting through the same durable, less-cyclical assets it is willing to acquire.
Furthermore, continuation vehicles have not absorbed the overflow. Sixty-nine continuation-fund exits closed globally through the second quarter, short of the pace needed to match the 158 closed in 2025. Sponsors appear willing to wait rather than accept the discount secondary buyers demand for uncertainty and illiquidity, a reasonable position for any individual manager and a collectively expensive one for the asset class. Median hold times at exit have come down to about 5.5 years from 6.4, but the book that has not sold keeps aging, with median existing hold times drifting up to roughly 4.2 years.
Fundraising Capital Formation Has Narrowed to the Top
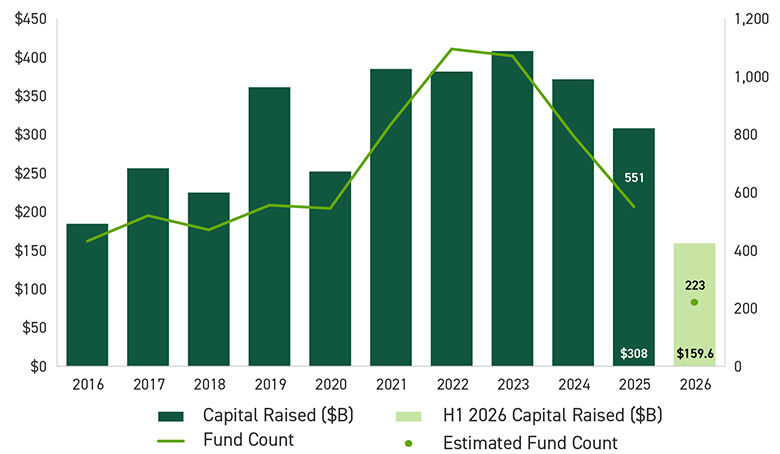
Fundraising responds to the distribution shortfall almost immediately, meaning when funds return less cash to their investors, those investors have less to recommit to new funds. Sponsors raised $159.6 billion across 223 funds year to date, on pace with 2025's muted $308 billion across 551 vehicles. This sum is far below the bumper years from 2021 through 2024, when annual totals ran between $371 billion and $408 billion across as many as 1,095 funds.
With this context, the second quarter's 60% increase in capital over the first can be viewed as a composition effect, rather than a recovery. Fund counts were essentially flat, and the capital jump can be traced to two closes: KKR's $23 billion North America Fund XIV in April and Clearlake's $14.8 billion Fund VIII in June. Fundraising is the lumpiest series in private capital, and a quarter carried by two mega-closes should not be mistaken for a turning point.
U.S. Private Equity Fundraising Activity ($B)
PitchBook | Geography: U.S.
As of June 30, 2026
Funds under $1 billion have drawn just 16.7% of all capital raised in 2026, signaling a severe concentration underneath these mega-closes. Experienced managers have pulled in $139.3 billion year to date against $20.3 billion for emerging managers, a ratio near seven to one. Only 23 first-time funds closed in the first half, against a full-year average of 181 from 2021 to 2023.
The mechanism is straightforward. Buyout distribution rates have run roughly 10 to 15 percentage points below the 25-year average since the 2021 vintage, with the distribution yield at 14.8% against a 23.4% long-run average. Limited partners receiving less back have fewer resources to recycle, and a sharper incentive to concentrate what they do commit with proven managers. This results in emerging and first-time managers competing for a shrinking residual.
The one genuine growth channel is U.S. evergreen PE assets, which nearly doubled over the past year to $99 billion from $50 billion, with recent launches from TPG, Carlyle, Brookfield, and CVC adding scaled competitors. Blackstone and KKR lead with a combined $26 billion across U.S. vehicles and a further $14 billion in European-domiciled funds.
The appeal of evergreen is structural, because these assets sit outside the stalled closed-end machine, and opening retirement channels to alternatives would make those inflows steadier still. If the traditional shortfall persists, evergreen will absorb a growing share of capital that once flowed into drawdown funds and concentrate it further in the hands of large, publicly traded general partners (GPs) with established wealth businesses.
Private Credit and the Redemption Run
Private credit is being tested through a full cycle for the first time (expansion, contraction, default wave, and recovery) and early 2026 delivered the first genuine scare. The stress surfaced in the semi-liquid vehicles that brought the asset class to retail and wealth channels.
After two private-equity-backed borrowers filed for bankruptcy in late 2025 — prompting JPMorgan's Jamie Dimon to warn that where there is one problem, there are usually more — sentiment turned sharply:
- Blue Owl became the most visible pressure point when investors sought to redeem more than 40% of shares in certain technology-focused vehicles and roughly 22% in its credit income funds.
- BlackRock, Morgan Stanley, Apollo and Cliffwater all faced redemption pressure, and several funds gated.
- Across larger non-traded business development companies, redemption requests ran near 15% in a single quarter against structures that promised roughly 5% quarterly liquidity.
The important nuance: This is less a classic run than an arithmetic mismatch. The 5% redemption gates that critics deride are precisely what converts a catastrophic overnight run into a slow, orderly grind — a meaningful improvement over the pre-2008 architecture, even if it does not feel that way to investors stuck behind a gate. The redemptions were driven far more by sentiment and software-sector fear than by realized portfolio deterioration; Blue Owl's own loans were performing broadly in line with expectations. Even so, the underlying credit questions are real. Headline default rates sit near 2%, but Lincoln International's shadow measure puts implied distress closer to 6%, and Morgan Stanley has cautioned that direct-lending defaults could climb toward 8%, according to a report published in Bloomberg.
Software and technology make up roughly a quarter of direct-lending portfolios — exposed to the same AI disruption unsettling equity underwriting — and covenant-lite structures offer thinner protection than lenders assumed. Contagion to the banking system appears contained, considering banks have lent an estimated $300 billion to private credit firms, according to a Moody’s report, and bank stocks sold off sharply. Most analysts judge the episode significant rather than systemic. In other words, we can view it as a scare, not another 2008. The likely outcome is consolidation toward fewer, larger, better-governed platforms and materially closer regulatory scrutiny.
Borrowing Against Illiquid Value: NAV and GP-level Financing
One of this cycle’s most consequential adaptations is the decision to borrow against value rather than realize it, and it is now happening at two levels of the capital structure. At the fund level, net asset value (NAV) financing lets a manager pledge the equity already deployed across a diversified pool of portfolio companies and borrow against it rather than sell assets into a soft market or accept discounts on fund stakes. Loan-to-value typically runs between 5% and 30%, increasingly at investment-grade ratings, with yields several hundred basis points over the secured overnight financing rate. The loans are non-dilutive and sit senior at the fund level, and the underlying appreciation continues to accrue to limited partners — monetizing paper gains without triggering the sale, tax and distributed to paid-in capital (DPI) consequences that a realization would.
Exit backlog and the elongated hold are driving the trend. PitchBook’s data put roughly $3.8 trillion of value tied up in some 32,000 unsold companies globally, with average holding periods stretching beyond the three to five years that sponsors typically promise, and buyout distributions running well below the long-term average. Facing that liquidity gap, managers have turned NAV loans from a niche, late-stage instrument into an embedded portfolio-management tool to fund add-on acquisitions, support portfolio companies, and, most notably, finance distributions to LPs without a sale. Buyout funds account for roughly 63% of the market, with continuation vehicles comprising a substantial share of deal flow, and lending is moving down-market to smaller funds.
The same pressure has produced a parallel response one level up. Carry that GPs once expected to collect on a predictable schedule is arriving later, if at all, and sponsors are borrowing against its expected future value rather than waiting. The instrument goes by several names — GP financing, management-company financing, carry-backed lending — and is typically provided by specialty lenders. Facilities are usually secured by a blend of GP commitments, management fee streams and carried interest rather than carry alone, since carry’s contingent, back-loaded nature makes it, in lenders’ own words, a challenging asset to lend against in isolation. Proceeds fund a GP’s own commitments to new and existing funds, buy out departing or minority partners as firms navigate succession, or supply working capital at the management company.
“Carry used to be the reward at the end. Now it is collateral. When exits stall, managers monetize what they can.”
Neither structure is without critics, and the objections compound when both are in use. Layering GP-level debt on top of fund-level NAV facilities and portfolio-company leverage concerns some LPs and regulators, and using borrowed money to fund distributions can flatter DPI without any underlying realization. If a GP has already monetized its carry, the alignment that carried interest is meant to create is worth revisiting. Deployed with discipline and transparency, both are rational responses to a liquidity environment sponsors did not choose. When deployed to paper over performance, they defer rather than solve the problem and add one more layer of leverage to a system already carrying several.
In Memoriam
Alan Greenspan, 1926–2026
The private equity industry that exists today is, in no small part, a product of the monetary era Alan Greenspan built. Greenspan, who died on June 22, 2026, at the age of 100, chaired the Federal Reserve from 1987 to 2006, the second-longest tenure in the institution's history, and shaped the conditions in which modern leveraged finance came of age. The extended stretches of low interest rates and accommodative policy over which he presided lowered the cost of the leverage that powers the buyout model, and the “Greenspan put” — the market's belief that the Fed would cushion serious downturns — helped underwrite two decades of risk appetite.
His legacy is genuinely double-edged. Celebrated as the “Maestro” of the long 1990s expansion and for his prescient warning about “irrational exuberance,” he was also faulted for the low rates and light-touch regulation that critics linked to the 2008 crisis. For an industry now navigating the higher-for-longer world his successors have engineered, Greenspan's career is a reminder of how the price of money can impact the flow of capital.

Cherry Bekaert’s Managing Director, Cameron Smith, pictured with the late Alan Greenspan and his wife, Andrea Mitchell, at Chevy Chase Club in Bethesda, MD.
Private Equity Emerging Trends and Outlook
The balance of 2026 will be defined less by whether activity recovers than by how sharply the market continues to divide. Five themes warrant close attention:
- Dispersion will widen before it narrows: The gap between managers who can show realized returns and those who cannot is now an industry-organizing fact visible in deal flow, fundraising, and LP re-ups alike. DPI, not IRR, will remain the metric that separates winners from the field, and the pressure to return actual cash will only intensify.
- The rate regime is the swing factor: With the Fed on hold and a hike no longer unthinkable, sponsors should underwrite to higher-for-longer financing and genuine two-sided risk. The direction of the Iran war and energy prices will move expectations more than any single data release, and the firms that prosper will compete on operational value creation rather than cheap leverage.
- Carve-outs and take-privates will carry deal flow: Corporate simplification, activist pressure, and AI-driven strategic reappraisal are producing a deep, durable pipeline of non-core assets. Well-capitalized sponsors are the natural buyers, provided they can execute complex separations with discipline.
- Private credit enters a phase of consolidation and scrutiny: The redemption episode exposed real questions about semi-liquid wrapper design, valuation opacity and software concentration. Expect fewer, larger, better-governed platforms, deeper bank partnerships, and a heavier regulatory hand even as the asset class keeps growing.
- The liquidity toolkit becomes a permanent infrastructure: Continuation vehicles, secondaries, NAV facilities, IPOs, and now carry-backed GP financing have evolved beyond stopgaps to an embedded feature in how sponsors manage capital across the fund lifecycle. Their growing use — alongside a smaller cohort of firms holding larger portfolios on average — will reshape fund economics, LP diligence and the very definition of an exit.
Underlying these emerging trends is the reality that capital is abundant, but patience is finite. And the force of AI cuts through each emerging trend, hollowing out yesterday’s winners while underwriting the winners of tomorrow. The managers who convert conviction into realized returns, and who can prove value rather than merely claim it, will define private equity dealmaking through the rest of the year and beyond.